Carbon is the currency of nature: the backbone of soil organic matter and the energy source for soil microorganisms. Therefore, much interest in soil health focuses on increasing carbon storage in soil. When you reduce tillage or increase crop rotation diversity, you expect soil organic matter to increase. However, soil organic matter often changes slowly for several years. In fact, less than 1% of plant biomass carbon returned to soil eventually becomes stable humus organic carbon.
Active carbon, also known as permanganate-oxidizable carbon (POXC), is a sensitive tool for measuring soil carbon change. This portion of soil organic matter is actively involved in nutrient cycling and changes more quickly when cropping systems are changed (e.g. reduced tillage, diversified crop rotation, cover crop inclusion). Active carbon is a quick, repeatable soil test that measures the easily oxidizable, biologically active carbon fraction.
Why is active carbon important?
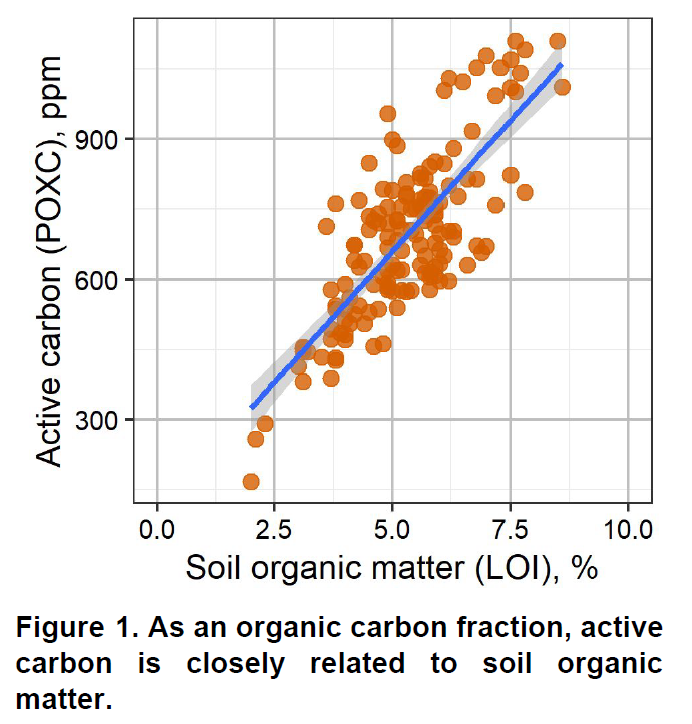
Active carbon typically comprises about 1 to 4% of total organic carbon in soil. It represents the microbially available carbon energy sources, that is microorganism food. As one component of the total organic carbon pool, active carbon has a strong relationship with overall soil organic matter (r = 0.80, Fig. 1), but it responds more quickly to changes in crop and soil management. It helps explain why two soils with 3% soil organic matter, for example, may behave differently regarding biological activity or nutrient cycling.
Active carbon should be utilized as a tracking tool to measure improvement in soil quality. In a 17-year tillage experiment in Mandan, ND, total organic carbon did not change much after conversion to no-till; however, active carbon increased significantly from 470 to 600 ppm (Weil et al., 2003). Recall that soil organic matter includes all forms of organic carbon (i.e. microbial biomass, recently decomposed plant material, stable humus) and requires large carbon inputs to change that total measurement. In contrast, the active carbon fraction increases much more quickly and detects improvements in soil quality sooner. This is why active carbon is considered a “leading” soil health indicator.
What do the numbers mean?
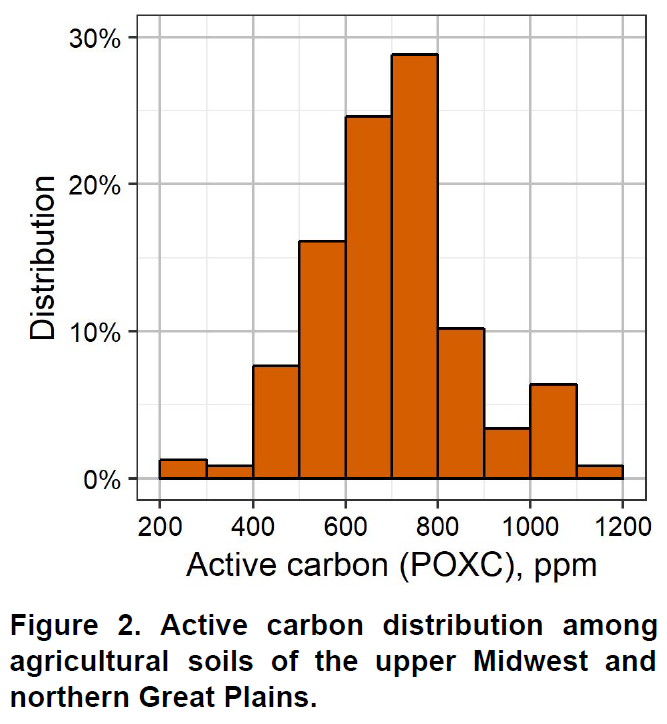
In agricultural soils of the upper Midwest and northern Great Plains, active carbon commonly ranges from less than 300 ppm to 1000 ppm (Fig. 2). As with soil organic matter, soil texture is a major factor controlling active carbon. Coarse-textured soils generally contain less active carbon than medium- or fine-textured soils. Native prairie soils may contain active carbon as high as 1500 ppm.
While these are the common active carbon values you may expect, each field and its history is different; therefore, making comparisons between fields is not advised. There are no index ranges for active carbon because different climatic regions and soil types cannot be judged by the same standard. Active carbon should be utilized as a tracking tool in improving the soil quality of that field or zone, rather than making broadscale comparisons.
Cropping systems that include reduced tillage or no-till, diversified crop rotations, and cover crops will help increase active carbon. In addition, any system with greater organic matter inputs (e.g., plant biomass, manure) helps build active carbon and soil organic matter. Under perennial grass, active carbon can easily exceed 1000 ppm.
With sensitive soil health tools like active carbon, you can more easily quantify positive changes achieved through better soil management.
How to soil sample
Active carbon can be added to any standard soil fertility analysis, simply requested as an analysis add-on. Collect the soil sample with standard soil probe. The standard soil sampling depth of 0-6 inches is most common. In reduced tillage and no-till systems, stratification may warrant 0-2 or 0-4 inch soil sampling depths. Like any soil health test, it is a tracking tool measuring soil quality improvement, so make sure you are using GPS-marked soil sampling points.
Frequently asked questions (FAQ)
Q: Does higher active carbon (POXC) indicate better crop yield?
A: Not necessarily. Crop yield is comprised of numerous determinants: genetics, climate, soil type, soil fertility, crop pests, etc. Active carbon measures the carbon sources available to microorganisms as food. This is only one factor within a wide range of various soil biological functions and yield-determining factors. Soil management practices that can improve crop production, such as no-till in water-limited environments, also work to improve soil properties like active carbon.
Q: Can I use active carbon to reduce fertilizer rates or modify plant population?
A: Active carbon has NOT been calibrated with fertilizer rate or plant population trials. So far, active carbon provides information on soil management . The relationships with crop productivity remain unclear. We must wait for more research to answer these yield-focused questions.
References
Weil, R.R., K.R. Islam, M.A. Stine, J.B. Gruver, and S.E. Samson-Liebig. 2003. Estimating active carbon for soil quality assessment: A simplified method for laboratory and field use. Am. J. Altern. Agric. 18(1):3–17.
Starter Fertilizer: Choosing the Right Rate
in Corn, Starter Fertilizer, Wheat/by John LeeStarter fertilizer placed with or near the seed is essential for vigorous early season growth in grass crops such as corn and wheat. We plant these crops early because we know vigorous early season growth is important to achieving high crop yields. Early planting also means cold soils, and starter fertilizer is necessary to get the crop going with a good start. Each spring, we receive many questions about starter fertilizer placement and seed-safe fertilizer rates. These questions come from farmers who want to plant as many acres per day as possible, take advantage of more efficient banded phosphorus placement, and of course reduce fertilizer costs.
The two most common questions we get are “What is highest rate of starter fertilizer I can apply with the seed?” and “What is the lowest rate of starter fertilizer I can apply with the seed and still get a starter effect?” South Dakota State University (SDSU) made a downloadable spreadsheet that calculates the maximum seed-safe fertilizer rate (Figure 1). The spreadsheet will ask for the crop choice, fertilizer product, seed opener width, row spacing, tolerable stand loss, soil texture, and soil water content. The spreadsheet calculations are based on SDSU greenhouse and field studies.
Figure 1. Fertilizer Seed Decision Aid from South Dakota State University. Download the spreadsheet here.
Research has shown, that to achieve the full starter effect, a fertilizer granule or droplet must be within 1.5 to 2.0 inches of each seed. If the fertilizer granule or droplet is more than 1.5 to 2.0 inches away from the seed, the starter effect is lost. To illustrate the role of starter fertilizer rates and seed placement, AGVISE put together displays showing the distance between fertilizer granules or droplets at various rates and row spacings. For example, take a look at wheat planted in 7-inch rows with 30 lb/acre P2O5 (57 lb/acre 11-52-0) and corn planted in 30-inch rows with 30 lb/acre P2O5 (7.5 gal/acre 10-34-0). You need to maintain a sufficient starter fertilizer rate to keep fertilizer granules or droplets with 1.5 to 2.0 inches of each seed.
Figure 2. Two examples from the AGVISE Starter Fertilizer Display series. Find more crops and fertilizer rates here.
In the northern Great Plains and Canadian Prairies, most fertilizer is applied at planting and often as seed-placed fertilizer. This creates a challenge to prevent soil nutrient mining when balancing seed safety and crop nutrient removal with higher crop yield potential. Soil nutrient mining occurs when you apply less fertilizer than crop nutrient removal, resulting in soil test P and K decline over time. Some broadleaf crops, like canola and soybean, are very sensitive to seed-placed fertilizer, allowing only low seed-placed fertilizer rates. In contrast, most cereal crops can tolerate higher seed-placed fertilizer rates. To maintain soil nutrient levels across the crop rotation, you need to apply more phosphorus fertilizer in crops that allow greater seed safety. You can apply more phosphorus fertilizer with crops like corn or wheat, which allows you build soil test P in those years, while you mine soil test P in canola or soybean years. If you cannot the maintain crop nutrient removal balance with seed-placed fertilizer, then you need to consider applying additional phosphorus in mid-row bands or broadcast phosphorus at some point in the crop rotation.
Table 1. Seed-safe fertilizer rates may not meet crop removal. In the example, the seed-safe limit is based on 1-inch disk or knife opener and 7.5-inch row spacing for air-seeded crops and 30-inch row spacing for corn. Phosphorus (P) balance: Seed-safe limit (lb/acre P2O5) minus crop P removal (lb/acre P2O5). A negative P balance indicates the seed-safe limit does not meet crop removal, which may decrease soil test P.
Starter fertilizer is an important part of any crop nutrition plan. Here are more resources to help you make the best decisions on starter fertilizer materials, placement, and rates.
Fertilizer Application with Small Grain Seed at Planting, NDSU
Safe Rates of Fertilizer Applied with the Seed, Saskatchewan Agriculture
Using banded fertilizer for corn production, University of Minnesota
Corn response to phosphorus starter fertilizer in North Dakota, NDSU
Wheat, barley and canola response to phosphate fertilizer, Alberta Agriculture
Preparing for Spring Soil Sampling
in Equipment/by John LeeEven when fall soil sampling weather cooperates, there is always some soil sampling to do each spring. No matter the spring conditions, the soil sampling window is tight if you are planning to collect soil samples and get the soil test results back in time for spring fertilizer decisions. You will want to pull soil samples before the field will carry a pickup truck, without leaving deep ruts, to maximize the spring soil sampling window. Your soil sampling rig choices are usually walking the field with a hand soil probe or using an ATV/UTV.
Over the years, many creative clients have outfitted UTVs with hydraulic soil sampling equipment to collect 24-inch soil cores in the spring. This has allowed soil samplers to get into a field about one week before it could carry a pickup truck. It is a big deal if you can get soil test results back one week sooner in the spring!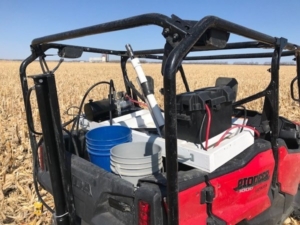
It is fairly simple to rig a UTV with the receiver hitch-mounted hydraulic soil sampling system kit. All you need to build is a wooden box to hold the electric-hydraulic power unit and a large starter battery. The hydraulic cylinder is mounted on a channel iron, which simply attaches to the receiver hitch. A large starter battery has enough charge to complete a good day of soil sampling without a recharge. Just make sure you put the battery on the charger overnight.
Some clients have created hydraulic soil sampling systems that can be quickly added and removed from a pickup truck box or UTV. It is a quick and easy add-on for the couple weeks of spring soil sampling that you may do. If you want some simple designs for self-contained soil sampling systems that can be removed in 10 minutes or less, these are some examples to consider.
Once the soil sample is collected, the next step in successful spring soil testing is getting them analyzed ASAP. AGVISE Laboratories knows that every spring soil sample is a rush, and our normal turnaround time is next-day (24 hours after soil sample is received). If you need any soil sampling equipment or supplies, we have everything in stock to ensure you get spring soil testing completed on time. We know spring soil testing can be stressful, but we hope to make it easier with the right soil sampling equipment and the reliable soil testing services that AGVISE has provided since 1976.
Adjusting high soil pH and salinity with sugar beet-processing spent lime
in Research, Saline and Sodic Soil, Soil Amendment, Soil pH/by John LeeThe sugar beet processing industry uses large quantities of fine-ground, high-grade calcium carbonate (lime) to purify sucrose in the sugar extraction process. The by-product spent lime retains high reactivity and purity, making it an attractive liming material for acidic soils. Application of spent lime is a common practice through the sugar beet producing areas of the upper Midwest and northern Great Plains, where its primary function is the suppression of the soil-borne disease Aphanomyces root rot of sugar beet. The spent lime also contains about 20 lb P2O5 per ton, mostly as organic phosphorus impurities gained from sugar refining.
We often get questions about correcting high soil pH and salinity with spent lime. Salt-affected soils, saline and sodic, are a common problem across the northern Great Plains. These soils have high soil pH and present numerous agronomic and soil management problems. The soil amendment gypsum (calcium sulfate) is often applied to sodic soils (those with high sodium) to combat soil swelling and dispersion. The spent lime (calcium carbonate) also contains calcium, but it is very insoluble at high soil pH.
Each year, we get many questions about applying spent lime on soils with high pH and salinity. To answer these questions, AGVISE Laboratories installed a long-term demonstration project in 2008 to evaluate adjusting high soil pH and salinity with spent lime. We applied multiple spent lime rates and tracked soil test levels over seven years. There were no significant changes or trends in soil pH (Table 1) or salinity (Table 2). This is no surprise because the initial soil pH was high and buffered around 7.8-8.2, indicating the presence of natural calcium carbonate. If the soil already contains naturally occurring lime, what is the good of adding more lime? Moreover, calcium carbonate is very insoluble, so there is no expectation that more lime will decrease or increase salinity.
Since soil test levels did not change over seven years, we terminated the project in 2014. The research question was a conclusive dud. While spent lime is useful to amend acidic soils and suppress Aphanomyces root rot of sugar beet, it does not help on soils with high pH or salinity.
Soil Testing and 4R Nutrient Stewardship
in AGVISE Laboratories, Environment, Precision Ag/by John BrekerEach year, farmers aim to increase agricultural production and profitability while conserving our land resources for the next generation. These tandem goals drive sustainable soil fertility and crop nutrition decisions on cropland across the world.
In 2005, global fertilizer industry and environmental stakeholders began developing a standard theme to emphasize science-based stewardship in soil fertility and crop nutrition. The theme eventually became known as 4R Nutrient Stewardship, where each “R” referred to the “right” way to manage nutrients for crop production. The 4Rs are summarized as managing crop nutrition with the 1) Right Source, 2) Right Rate, 3) Right Time, and 4) Right Place.
To successfully implement 4R Nutrient Stewardship, you must start with a high-quality soil sample and an informative soil test. To begin, the fertilizer need and amount is determined through soil testing, which is based on regionally calibrated soil test levels for each crop. If you do not have a soil test, how do you know what the Right Rate is? Using crop removal rates or simply guessing without soil testing often leads to overapplication of fertilizer, cutting into profit.
A conventional whole-field composite soil sample (one soil sample per field) is certainly better than no soil sample. It gets you in the ballpark, but it does not detect variation in soil nutrient levels across the field. You might underapply fertilizer on high yielding parts and overapply fertilizer on low yielding parts. To get the Right Rate applied in the Right Place, precision soil sampling, either grid or zone, is the best way to determine the appropriate fertilizer rate and where to apply it in each field. Precision soil sampling is a proven tool to reduce over- and under-fertilization across fields, thus optimizing crop yield and profitability while reducing the potential risk of soil nutrient loss to the environment.
When you start soil sampling and making soil fertility plans for next year, keep 4R Nutrient Stewardship in mind. AGVISE Laboratories is a proud 4R Partner. To learn more about the 4Rs or become a 4R Partner, visit the 4R Nutrient Stewardship website.
Active carbon (POXC): What does it measure?
in Soil Chemical Analysis, Soil Health/by John BrekerCarbon is the currency of nature: the backbone of soil organic matter and the energy source for soil microorganisms. Therefore, much interest in soil health focuses on increasing carbon storage in soil. When you reduce tillage or increase crop rotation diversity, you expect soil organic matter to increase. However, soil organic matter often changes slowly for several years. In fact, less than 1% of plant biomass carbon returned to soil eventually becomes stable humus organic carbon.
Active carbon, also known as permanganate-oxidizable carbon (POXC), is a sensitive tool for measuring soil carbon change. This portion of soil organic matter is actively involved in nutrient cycling and changes more quickly when cropping systems are changed (e.g. reduced tillage, diversified crop rotation, cover crop inclusion). Active carbon is a quick, repeatable soil test that measures the easily oxidizable, biologically active carbon fraction.
Why is active carbon important?
Active carbon typically comprises about 1 to 4% of total organic carbon in soil. It represents the microbially available carbon energy sources, that is microorganism food. As one component of the total organic carbon pool, active carbon has a strong relationship with overall soil organic matter (r = 0.80, Fig. 1), but it responds more quickly to changes in crop and soil management. It helps explain why two soils with 3% soil organic matter, for example, may behave differently regarding biological activity or nutrient cycling.
Active carbon should be utilized as a tracking tool to measure improvement in soil quality. In a 17-year tillage experiment in Mandan, ND, total organic carbon did not change much after conversion to no-till; however, active carbon increased significantly from 470 to 600 ppm (Weil et al., 2003). Recall that soil organic matter includes all forms of organic carbon (i.e. microbial biomass, recently decomposed plant material, stable humus) and requires large carbon inputs to change that total measurement. In contrast, the active carbon fraction increases much more quickly and detects improvements in soil quality sooner. This is why active carbon is considered a “leading” soil health indicator.
What do the numbers mean?
In agricultural soils of the upper Midwest and northern Great Plains, active carbon commonly ranges from less than 300 ppm to 1000 ppm (Fig. 2). As with soil organic matter, soil texture is a major factor controlling active carbon. Coarse-textured soils generally contain less active carbon than medium- or fine-textured soils. Native prairie soils may contain active carbon as high as 1500 ppm.
While these are the common active carbon values you may expect, each field and its history is different; therefore, making comparisons between fields is not advised. There are no index ranges for active carbon because different climatic regions and soil types cannot be judged by the same standard. Active carbon should be utilized as a tracking tool in improving the soil quality of that field or zone, rather than making broadscale comparisons.
Cropping systems that include reduced tillage or no-till, diversified crop rotations, and cover crops will help increase active carbon. In addition, any system with greater organic matter inputs (e.g., plant biomass, manure) helps build active carbon and soil organic matter. Under perennial grass, active carbon can easily exceed 1000 ppm.
With sensitive soil health tools like active carbon, you can more easily quantify positive changes achieved through better soil management.
How to soil sample
Active carbon can be added to any standard soil fertility analysis, simply requested as an analysis add-on. Collect the soil sample with standard soil probe. The standard soil sampling depth of 0-6 inches is most common. In reduced tillage and no-till systems, stratification may warrant 0-2 or 0-4 inch soil sampling depths. Like any soil health test, it is a tracking tool measuring soil quality improvement, so make sure you are using GPS-marked soil sampling points.
Frequently asked questions (FAQ)
Q: Does higher active carbon (POXC) indicate better crop yield?
A: Not necessarily. Crop yield is comprised of numerous determinants: genetics, climate, soil type, soil fertility, crop pests, etc. Active carbon measures the carbon sources available to microorganisms as food. This is only one factor within a wide range of various soil biological functions and yield-determining factors. Soil management practices that can improve crop production, such as no-till in water-limited environments, also work to improve soil properties like active carbon.
Q: Can I use active carbon to reduce fertilizer rates or modify plant population?
A: Active carbon has NOT been calibrated with fertilizer rate or plant population trials. So far, active carbon provides information on soil management . The relationships with crop productivity remain unclear. We must wait for more research to answer these yield-focused questions.
References
Weil, R.R., K.R. Islam, M.A. Stine, J.B. Gruver, and S.E. Samson-Liebig. 2003. Estimating active carbon for soil quality assessment: A simplified method for laboratory and field use. Am. J. Altern. Agric. 18(1):3–17.
Uffda, that’s a lot of potash!
in Base Cation Saturation Ratio, Potassium/by John LeeQuestion: Can you really change the %K base cation saturation ratio?
This winter, we have gotten more questions from farmers asking about the base cation saturation ratio (BSCR) concept. The farmers had attended a series of meetings where the speakers encouraged farmers increase the %K saturation in their soils and apply high potassium fertilizer rates to soils, even though there was little to no chance to get a crop yield response. In short, the BSCR concept revolves around reaching a certain percentage (%) of each base cation in your soil to obtain the “ideal” soil. If you do not have the right percentage of each cation, then you are instructed to apply large amounts of fertilizer to reach this “ideal” balance of each cation. Potassium is the most common nutrient where people fall into the BSCR trap, often suggesting that extra potassium will “fix” their soil.
Since the 1940s, university and industry researchers from around the world have thoroughly debunked the BCSR concept. But sometimes, you just need to show people how this works in the real world to get their attention. To help farmers see the silliness of the BSCR concept, we conducted a simple field project in 2015 to show just one flaw in the failed BSCR concept, focusing on its primary claim that you can actually change the %K saturation in soil. We identified three soils in Manitoba, Minnesota, and North Dakota with low initial %K saturation. The goal was to increase %K saturation into the 4 to 6% range, which is recommended by BCSR promoters. We applied a staggering rate of 1000 lb/acre K2O (1666 lb/ acre potassium chloride, KCl, 0-0-60). You are probably thinking that 1000 lb/acre K2O is a lot of potash! And so did we. We called the project the “uffda” project because my Norwegian grandfather, who farmed in southern Minnesota 60 years ago, would have looked at the high rate and said, “Uffda, that’s a lot of potash!”
But, we failed to achieve the “ideal” 4 to 6% K saturation (Table 1). As expected, soil test K (part per million, ppm) increased substantially, but the %K saturation did not reach the “ideal” soil range even with the enormous potassium fertilizer rate.
Do you need more proof? Let’s see what the plants said. The soybean plant tissue K concentrations did not change either because the soil test K (ppm) was sufficient and above the 150 ppm critical level (Table 2). Simply put, the proven university-developed soil fertility guidelines would have told you that more potassium was not needed. I know a few farmers who were convinced to follow the BCSR concept, which only wasted their valuable dollars and time on the failed idea.
STK 150 ppm
STK 190 ppm
All things considered, there are still good reasons to apply potassium fertilizer (moderate rates) to achieve profitable yield responses. Either way, the base cation saturation ratio (BCSR) concept is a really bad way to justify potassium fertilizer use, and it usually leads to very high fertilizer rates and costs. Here are some good reasons to include potassium in your soil fertility program:
Soil aggregate stability: What does it measure?
in Soil Health, Soil Physical Analysis/by John BrekerSoil aggregates are the building blocks of soil structure. Soil texture is the relative percentage of sand, silt, and clay in soil, but soil structure describes how those particles are arranged in the soil profile. Soil aggregates are glued together with soil organic matter, plant root exudates, and microorganisms like fungi.
We classify soil aggregates by their size: large macroaggregates (>2000 μm), macroaggregates (250-2000 μm), microaggregates (53-250 μm), and free particles (<53 μm). A large macroaggregate is bigger than a sand particle. A microaggregate has the thickness of one or two human hairs. A macroaggregate lies in between.
Multiple soil management practices come together to improve soil aggregate stability. These include reduced tillage or no-till, greater crop rotation diversity, more plant roots, greater earthworm and microbial activity, and more soil organic matter. This is what makes soil aggregate stability such an attractive soil health indicator. Stable soil aggregates take time to form, so you should consider measuring soil aggregate stability every 3 to 5 years.
Why is soil aggregate stability important?
Soil aggregate stability is a comprehensive soil quality measurement. Soil aggregates provide numerous soil ecosystem services:
● Resistance to water and wind erosion
● More pore space for air and water movement, allowing deep root exploration
● Faster water infiltration, reduced runoff
● Less surface crusting
● Improved equipment trafficability and reduced soil compaction, especially on wet soils
● Diverse habitat for soil microorganisms
Strong soil aggregates form naturally with plant root and microbial activity. However, disturbances like tillage quickly break soil aggregates apart. If soil aggregates are broken apart by tillage, the soil pores fill with small particles that can clog and restrict air and water movement. Loose soil particles can also plug the surface pore network to reduce water infiltration and cause surface crusting.
Cropping systems that include reduced tillage or no-till are necessary to improving soil aggregate stability (Figure 2). Tillage also reduces soil organic matter that is needed to bind soil particles into larger soil aggregates. Diversified crop rotations, cover crops, and manure help improve soil aggregate formation.
Soil texture is a major factor in soil aggregate formation. Coarse-textured soils may take longer to develop soil aggregates. Fine-textured soils tend to develop soil aggregates quickly. This is important because good soil structure with large pore spaces is essential to air and water movement through fine-textured soils.
What do the numbers mean?
You can see large soil aggregates (>2000 μm) with the naked eye, but quantifying the different water-stable soil aggregate sizes must be done in the laboratory. This requires special wet sieving equipment that sorts the water-stable soil aggregates by size.
If you see the water-stable macroaggregate fractions increasing, you know that you are making real improvements in soil quality. Soils with high soil aggregate stability have less soil erosion, better equipment trafficability, faster water infiltration, and more diverse habitat for soil microorganisms. Increasing soil aggregate stability should be a long-term goal in all cropping systems.
Soil aggregate stability should be utilized as a tracking tool in improving soil quality. Each field has a different cropping history and soil type (e.g. soil texture); therefore, making broadscale comparisons between fields is not advised.
How to soil sample
A separate soil sample must be taken for soil aggregate stability. Unlike routine soil fertility analysis, this soil sample cannot be dried and ground (destroys soil aggregates). Soil aggregate stability requires special equipment and more labor than routine soil fertility analysis; ask about turnaround time when submitting soil samples.
Collect an undisturbed soil slice with tiling spade or tulip bulb planter (Figure 3); this helps prevent destruction of soil aggregates. Do not collect the soil sample with a soil probe because the soil probe will destroy or compress soil aggregates. Place the soil sample in one-quart plastic bag and clearly mark with permanent marker “SOIL AGGREGATE STABILITY. DO NOT GRIND.” Like any soil health test, it is a tracking tool measuring soil quality improvement, so make sure you are using GPS-marked soil sampling points.
References
Mikha, M.M., and C.W. Rice. 2004. Tillage and manure effects on soil and aggregate-associated carbon and nitrogen. Soil Sci. Soc. Am. J. 68(3):809–816.
Starter Fertilizer Display: How low can YOU go?
in Canola, Corn, Phosphorus, Soybean, Starter Fertilizer, Sugar Beet, Wheat/by John LeeWhen profits are squeezed, more farmers are asking about optimal starter fertilizer rates and how low starter fertilizer rates can be. These questions are the result of wanting to keep fertilizer costs down, to plant as many acres per day as possible, and to take advantage of more efficient, lower rates of banded phosphorus fertilizer compared to higher rates of broadcast phosphorus fertilizer.
The displays show the normal seed spacing for several crops with different dry or liquid fertilizer rates alongside the seed. These displays help visualize the distance between the seed and fertilizer at several rates. University research shows that to achieve the full starter effect, a fertilizer granule or droplet must be within 1.5-2.0 inches of each seed. If the fertilizer granule or droplet is more than 1.5-2.0 inches away from the seed, the starter effect is lost. Some people wonder about these displays, but you can prove it to yourself pretty easily. Just run the planter partially down on a hard surface at normal planting speed. You will see what you imagine as a constant stream of liquid fertilizer, ends up being individual droplets at normal speed, especially with narrow row spacings and lower fertilizer rates.
These displays help illustrate the minimum starter fertilizer rate to maintain fertilizer placement within 1.5-2.0 inches of each seed for the full starter effect. In addition to an adequate starter fertilizer rate, additional phosphorus and potassium should be applied to prevent nutrient mining, causing soil test levels to decline in years when minimum fertilizer rates are applied.
Adjusting low soil pH with sugar beet-processing spent lime
in Research, Soil Amendment, Soil pH/by John LeeThe sugar beet processing industry uses large quantities of fine-ground, high-grade calcium carbonate (lime) to purify sucrose in the sugar extraction process. The by-product spent lime retains high reactivity and purity, making an attractive liming material for acidic soils. Application of spent lime is a common practice through the sugar beet producing areas of the upper Midwest and northern Great Plains, where its primary function is the suppression of the soil-borne disease Aphanomyces root rot of sugar beet. The spent lime also contains about 20 lb P2O5 per ton, mostly as organic phosphorus impurities gained from sugar refining.
AGVISE Laboratories installed a long-term demonstration project in 2014 to evaluate adjusting low soil pH with spent lime. The project site was located near our Northwood Laboratory. Northwood lies along the beachline of glacial Lake Agassiz, where well-drained coarse-textured soils with low pH are common. We located a very acidic soil with soil pH 4.7 (0-6 inch), which was the perfect site to evaluate lime application. In May 2014, spent lime was applied and incorporated with rototiller. The spent lime quality was very high at 1,500 lb ENP/ton. In Minnesota, lime quality is measured as effective neutralizing power (ENP), which measures lime purity and fineness. Soil pH was tracked over three years (Table 1).
The lowest spent lime rate (2,500 lb ENP/acre) increased soil pH above 5.5. This soil pH reduced aluminum toxicity risk, but it did not reach the target pH 6.0, appropriate for corn-soybean rotation. The highest spent lime rate (10,000 lb ENP/acre) increased soil pH above 7.0 and maintained soil pH for several years. Spent lime is a fine-ground material with high reactivity, so its full effects were seen in the first application year. The project showed that spent lime is an effective liming material for low pH soils.
High soil pH and calcium carbonate inflate base cation saturation and cation exchange capacity (CEC)
in Base Cation Saturation Ratio, Research, Soil Chemical Analysis, Soil pH/by John BrekerSoil pH is a soil chemical property that measures soil acidity or alkalinity, and it affects many soil chemical and biological activities. Soils of the northern Great Plains and Canadian Prairies often have high soil pH (>7.3) and contain calcium carbonate (free lime) at or near the soil surface. It is the calcium carbonate in soil that maintains high soil pH and keeps it buffered around pH 8.0. The calcium carbonate originates from soil formation processes since the latest glacial period.
Soils with high pH and calcium carbonate create analytical challenges in determining cation exchange capacity (CEC) and subsequent base cation saturation ratio (BCSR) calculations. Cation exchange capacity is the amount of positive-charged cations (e.g. ammonium, calcium, hydrogen, magnesium, potassium, sodium) held on negative-charged soil particles, like clay and organic matter. Fine-textured soils (high clay content) and organic soils (high organic matter content) have high CEC, while coarse-textured soils (low clay content) have low CEC. The BSCR is the relative proportion of base cations in soil.
The routine laboratory method to determine CEC is the summation method, where all extractable cations on soil particles are added together. The assumption is that all positive-charged cations extracted are held on negative-charged exchange sites on soil particles. The assumption falls apart in soils with pH > 7.3 because the soil test method also extracts calcium from the naturally occurring soil mineral calcium carbonate, which is not held on cation exchange sites. The resulting amount of extractable calcium is inflated. The summation procedure still sums together the inflated calcium result, producing an inaccurate and inflated CEC result. Any subsequent base cation saturation calculations are similarly flawed.
To illustrate the inflated CEC problem, AGVISE Laboratories conducted a laboratory experiment. The experiment showed that more calcium carbonate in soil increased the amount of extractable calcium (Table 1). Furthermore, the inflated amount of extracted calcium also inflated the CEC because all the extractable cations are summed together. The correct CEC is 24 cmolc/kg, yet the inflated CEC could be 150 to 200% higher with increasing calcium carbonate content. Adding calcium carbonate to soil did not increase the inherent CEC sources, i.e. clay and organic matter, yet the laboratory CEC result increased. In reality, the ability to hold more cations did not change. This highlights the analytical challenge in determining CEC via summation method on soils with high pH and calcium carbonate.
The subsequent base cation saturation calculations were also affected, showing much lower percent potassium saturation as calcium carbonate content increased (Table 2). This presents a major challenge in using the base cation saturation ratio (BCSR) concept to guide soil fertility and plant nutrition on soils with high pH and calcium carbonate. Without an accurate analytical method, the BCSR concept loses its grounding and any practical application.
In general, the routine CEC method via summation of cations is quite accurate on soils with pH less than 7.3 and no calcium carbonate. However, the routine method has clear challenges on soils with pH greater than 7.3. The resulting CEC and subsequent base cation saturation calculations are inflated and/or flawed. This is why the BCSR concept is extremely misleading on soils with high pH.