Corn Growth and Development – Are we behind?

This article originally appeared in the AGVISE Laboratories Fall 2022 Newsletter under Southern Trends

The spring and early summer were very interesting to say the least. Spring rains continued well into late May and delayed planting for sugar beet, corn, and soybean throughout the southern region. By mid-May, many producers changed long-day corn maturities to earlier corn maturities. In the Benson, MN neighborhood, corn planting finally got underway around May 20 (60% planted) and near completion on June 5 (93% planted). Around the coffee shop, many people have commented, “How far behind is the corn crop in 2022?” So, let’s put some numbers to this question.

The High Plains Regional Climate Center has a nice growing degree day (GDD) calculator for simulations of corn growth and development (https://hprcc.unl.edu/agroclimate/gdd.php). I made a few GDD simulations for previous years, comparing 2022 with 2019 (a below-average GDD year) and 2021 (an incredible GDD year). As of mid-July, the 2022 growing season was 3 days ahead of 2019 (63 more GDD) and 9 days behind 2021 (182 fewer GDD). A corn plant takes about three days to make a new leaf when the corn plant is V12 and younger, so you can guesstimate that we were about 3 leaf stages behind 2021.

With the late spring planting window, many corn producers around Benson, MN opted for corn maturities about 6 to 8 days earlier than normal. If you compare an earlier 92-day corn maturity with a more typical 100-day corn maturity, the required GDD to blacklayer is 2207 and 2401 GDD, respectively. We generally accumulate 20-30 GDD per day in midsummer. If either corn maturity was planted on May 20, the estimated silking (R1 stage) date is July 21 for the 92-day maturity and July 25 for the 100-day maturity, a difference of four days. Similarly, the estimated blacklayer (R6 stage) date is September 18 for the 92-day maturity and October 12 for the 100-day maturity, a difference of 24 days. Toward the end of the growing season when fewer GDD are accumulated per day, the difference in maturity groups really starts to show. Warmer than average temperatures will shorten that difference, but only time will tell if the right decision was to plant earlier corn maturities.

Nielsen, R. L. The Planting Date Conundrum. Corny News Network, Apr. 2022. Purdue Univ., West Lafayette, IN. https://www.agry.purdue.edu/ext/corn/news/timeless/pltdatecornyld.html

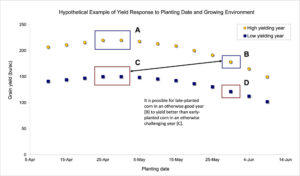
To help drive home the point about planting date and final corn grain yield, I really like the graph from Dr. Bob Nielsen at Purdue University (figure above). Early planting does not always result in very high corn yield, and late planting does not always result in very low corn yield. In 2022, late planting will limit top-end crop yield potential, but the final crop yield could still be good as long as GDD accumulation remains above average. As always, Mother Nature will be the final determinant in setting the final crop yield.

2021 Drought: High residual soil nitrate-nitrogen across the region

This article originally appeared in the AGVISE Laboratories Winter 2022 Newsletter

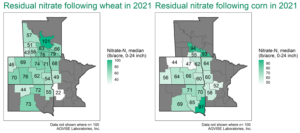
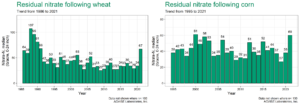
The 2021 drought rivals the 1988 drought, and it covered much of the northern Great Plains and Canadian Prairies. From previous experience with droughts, we expected that residual soil nitrate-N following crops would be higher than normal, caused by the drought and reduced crop yields. The first wheat fields that were soil tested in August and September confirmed our expectation that residual soil nitrate-N was already trending much higher than normal.

The 2021 AGVISE soil test summary data highlights how exceptional the 2021 drought was. The median amount of soil nitrate-N across the region was markedly higher following wheat and corn. Over 20% of wheat fields had more than 100 lb/acre nitrate-N (0-24 inch) remaining, and another 40% of wheat fields had a sizable 40 to 80 lb/acre nitrate-N (0-24 inch) left over. For any given farm, the great variability in residual soil nitrate-N makes choosing one single nitrogen fertilizer rates impossible, and soil testing is the only way to decide that right rate for each field.

Through zone soil sampling, we were also able to identify that residual soil nitrate-N varied considerably within a field. This makes sense because we know that some areas of the field produced a fair yield, leaving behind less soil nitrate, while other areas produced very poorly and left behind much more soil nitrate. These differences across the landscape are driven by soil texture, soil organic matter, and stored soil water as well as specific problems like soil salinity or low soil pH (aluminum toxicity). Although the regional residual soil nitrate-N trends were higher overall, it is truly through zone soil sampling that we can begin to make sense of the field variability that drives crop productivity and the right fertilizer rate for next year.

For fields that have not been soil tested yet, there is still time to collect soil samples in winter (see winter soil sampling article). Nobody wants to experience another drought, but this kind of weather reminds us how important soil nitrate testing is every year for producers in the Great Plains. Each year, AGVISE summarizes soil test data for soil nutrients and properties in our major trade region of the United States and Canada. For more soil test summary data and other crops, please take a look at our soil test summaries online.


How much residual soil nitrate is left after the 2021 corn crop?

It’s probably more than you think.

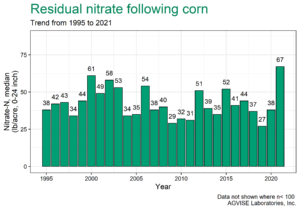
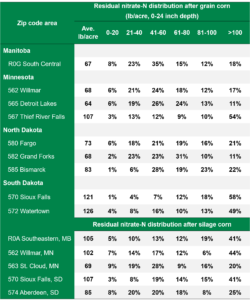
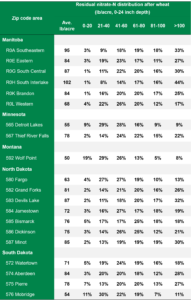
So far, the residual soil nitrate-nitrogen trend following corn is much higher than average across the upper Midwest and northern Great Plains. This follows the same trend set by the 2021 wheat crop. For many growers in the region, the hot and dry growing season has resulted in high residual soil nitrate-N carryover where corn yield was lower than average. An update on average residual soil nitrate-N after grain and silage corn, broken into zip code areas, can be found below (Table 1). This data highlights the importance of soil sampling for nitrate-N, even after high N-requirement crops you may not think of leaving much residual soil nitrate-N behind.

Bar graph showing median residual nitrate-N in lb/acre for fields sampled after grain corn as of Oct. 11, 2021. Results include fields tested in MN, ND, SD, and MB. Fields tested thus far are on pace to set a record for amount of nitrate-N left after corn.

The early soil nitrate-N trend data gives us a snapshot of the soil samples that AGVISE has analyzed so far. The average soil test data is not a replacement for actual soil test results on your fields or your clients’ fields. There is considerable variability within a single zip code area, with some corn fields having less than 20 lb/acre nitrate-N and many other fields that are much higher. Take a look at eastern South Dakota, the Sioux Falls and Watertown areas have over 49% of soil samples with more than 100 lb/acre nitrate-N (0-24 inch soil depth). Considering sky-high nitrogen fertilizer prices (and still rising), it makes sense to soil test for nitrate-N and credit it toward next year’s crop nitrogen budget.

Agronomic considerations for soybean in 2022

One crop that will not benefit from extra residual soil nitrate-N after corn is soybean. Soybean can create its own nitrogen thanks to a symbiotic relationship with nitrogen-fixing bacteria. The nitrogen fixation process takes energy, however, and if there is already ample plant-available nitrate in the soil, soybean will delay nodulation and take advantage of the free nitrate. Delayed nodulation may ultimately lead to soybean yield loss.

High residual soil nitrate-N can also increase soybean iron deficiency chlorosis (IDC) severity.  Soybean IDC is a challenge for growers in the upper Midwest, northern Great Plains, and Canadian Prairies, especially on soils with high carbonate and salinity. If soil nitrate-N is also high, research has shown it can make soybean IDC even worse and result in lower soybean yield. If you plan to grow soybean on fields with high residual soil nitrate-N, seriously consider IDC-tolerant soybean varieties or consider planting them on fields with lower residual soil nitrate-N.

Should a corn-corn rotation be considered after a drought year and high soil nitrate?

Planting a second corn crop would allow a producer to capture this “free” nitrate-N in the soil profile. However, planting corn on corn has many challenges from soil moisture to insect pressures (e.g. corn rootworm). The 2021 corn crop started the growing season with a full profile of water (due to excessive moisture in 2019 and adequate moisture in 2020) and ended with enough to push the corn crop through harvest. Going into the 2022 growing season, plant available water will be considerably less than the beginning of 2021. If the drought continues into 2022, remember that corn requires more moisture than soybean, so planting corn on corn means putting a higher water-requiring crop on ground that had less water to start with (versus corn following soybeans). Less available moisture, combined with other agronomic pressures, may mean less than expected yield for a corn-on-corn rotation.

Table 1. Residual nitrate trends as of Oct. 11, 2021 from more than 2,500 soil samples taken after corn. Regions with less than 60 soil samples are not included in the table.

Corn Stalk Nitrate Test

To help evaluate nitrogen management in corn, you may want to try the corn stalk nitrate test as a post-mortem tool. The corn stalk nitrate test is a late-season or end-of-season plant analysis on mature corn stalks. Iowa State University developed the corn stalk sampling protocol and interpretation. If corn did not have sufficient nitrogen, the corn stalk nitrate level will be low. If corn had excess nitrogen, the corn stalk nitrate level will be high.

The corn stalk nitrate test can be useful in cropping systems with manure or corn-after-alfalfa, where a significant portion of the crop nitrogen budget comes from nitrogen mineralization. It is also helpful in more humid climates, where the residual soil nitrate-nitrogen test is not utilized. For corn silage production, it is easy to collect corn stalk samples on the go during silage harvest, making it a quick and useful tool.

Since the corn stalk nitrate test is a post-mortem tool with the goal to provide information for future years, it is not recommended in years with abnormal precipitation. In drought years, potential crop productivity is reduced, so the plant nitrogen requirement is lower than normal. In high precipitation years, soil nitrogen losses will reduce the available nitrogen supply. As a result, the corn stalk nitrate level can be very high in drought years or very low in wet years. Such results say more about environmental conditions, not the adequacy of the nitrogen fertilizer program.

When to sample

  • Early: One-quarter milk line (R5 growth stage) on majority of corn kernels. Nitrate concentration may be high if collected early.
  • Optimum: One to three weeks after physiological maturity (black layer, R6 growth stage) on 80% of corn kernels.
  • Late: Up to harvest. Nitrate concentration may be low if rainfall has leached nitrate from plant material.

How to sample

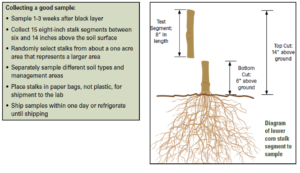
  • Measure 6 inches from the ground, cut the next 8 inches of corn stalk (the 6-14 inch stalk section measured from plant base). Remove outside leaf sheath.
  • Collect 12 to 15 corn stalks.
  • Place corn stalks in a ventilated plant tissue bag. Do not use plastic or zipped bag.
  • Do not collect diseased or damaged corn stalks.

Table 1. Corn Stalk Nitrate Test Interpretation

Nitrate-N (NO3-N), ppm Interpretation Comment
<250 Low Nitrogen supply was likely deficient and limited corn grain yield
250-2000 Sufficient
>2000 High Nitrogen supply exceeded plant requirement

for corn stalk nitrate test article

Updated Residual Soil Nitrate Trends (Variability is high this year)

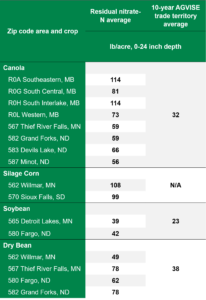
The 2022 growing season may seem like a long way off, but spring will be here before we know it. In fact, many growers are already making (or have made) crop choices and seed variety decisions for 2022. One factor that must be considered when making crop and variety selections for 2022 is residual soil nitrate-nitrogen following the 2021 growing season. For many in the northern Great Plains and Canadian Prairies, the 2021 growing season was hot and dry, which resulted in high residual soil nitrate levels following many crops. An update on average residual nitrate levels after wheat, broken down by geography, is below (Table 1). Residual soil nitrate-nitrogen following other crops, including soybean, are also higher than average (Table 2). This highlights the importance of soil sampling, even after crops we do not typically think of leaving high residual soil nitrate behind.

The data in the tables represents a snapshot of the samples we have tested so far this fall. While the average residual soil nitrate-nitrogen for an area may be interesting to talk about, it is not a replacement for actual soil test results from you or your growers’ fields. The data shows that over 30% of the wheat fields in many areas (see the right-hand column of the table) test over 100 lb/acre soil nitrate (0-24 inch depth). Droughts like 1988 and 2021 are very uncommon and leave us in situations that we are not used to dealing with. Using an average soil nitrate level from a region to decide an N rate on an individual field would be like deciding to apply an insecticide on every acre of the farm without even looking at each field to see if the insect is present. You need actual soil test data on each field to make informed decisions.

Table 1. Residual nitrate trends as of Sept. 17, 2021 from more than 20,000 soil samples taken after wheat. Regions with less than 100 soil samples are not included in the table.

Table 2. Residual nitrate trends as of Sept. 17, 2021 for crops other than wheat. Regions with less than 100 soil samples for each respective crop are not included in the table.

High Fertilizer Prices

According to the September 15, 2021 DTN fertilizer price survey, retail fertilizer prices continue to rise. The average price per pound of nitrogen by fertilizer product is $0.61/lb N for urea, $0.46 lb/N for anhydrous ammonia, and $0.66/lb N for UAN-28. This represents a 55%, 73%, and 71% increase in price compared to prices for the same fertilizers this time last year. Long story short, fertilizer is expensive. High residual soil nitrate following wheat may help reduce input costs in 2022, as long as you know what the residual soil nitrate in your fields is and take advantage of it by growing a crop that requires nitrogen fertilizer. If you have a soil nitrate test of 80 lb/acre (0-24 inch) after wheat, that is about 50 lb more than normal carry over. The extra 50 lb/acre soil nitrate is worth $30.00/acre (based on the current urea price).

Update: Feed Nitrate Testing in a Drought Year

Drought continues to stress crops across the upper Midwest and the Canadian Prairies. As crop conditions continue to deteriorate in some places, we have received more phone calls about salvaging the drought-stressed crop as livestock feed and the need for feed nitrate testing. As you consider what to do with your standing crop, whether to harvest for grain or cut for hay, an important part of that consideration will be the nitrate concentration of the crop.

When drought-stressed annual crops (e.g., wheat, barley, oat, corn) are cut or grazed, producers must exercise caution about livestock nitrate poisoning when feeding these forages. Drought-stressed crops often accumulate nitrate because plant uptake of nitrate exceeds plant growth and nitrogen utilization. Nitrate is usually concentrated in lower plant parts (lower stem or stalk). When livestock, particularly sheep and cattle, ingest forages with a high nitrate concentration, nitrate poisoning can occur.

Instructions for collecting and submitting a feed nitrate test

1. Collect the plant part that livestock will consume, which may be the whole aboveground plant. If grazing, be mindful of the grazing height because the plant nitrate concentration will be lower near the base of the plant. If baling for hay or chopping for silage, cut at the intended cutter bar height.

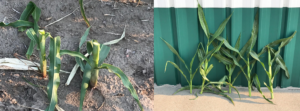
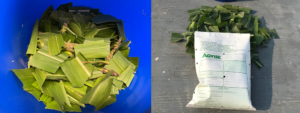
Picture used for feed nitrate email - corn collage

2. Cut plant material with sturdy garden shears into 1- to 2-inch pieces. Mix the chopped plant parts together and take one quart-sized subsample for analysis (about four good handfuls).

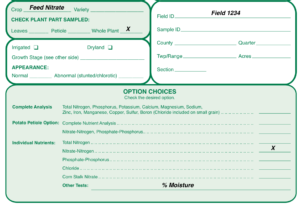
3. Place subsample in AGVISE Plant Sample Bag. Write “Feed Nitrate” as the crop choice and select “Nitrate-nitrogen” as the analysis option.

    • If you are considering chopping corn for silage, also write “%Moisture” as an additional analysis because you will need to know if the moisture content is still adequate for silage fermentation. You may be surprised how much water will still be in drought-stressed corn stalks.

4. Ship plant sample to AGVISE Laboratories. If you cannot ship the sample right away, store it in a refrigerator until you can ship it.

IMPORTANT: Resample the hay or silage before feeding to any livestock. You need to know what is actually being fed to livestock, and you may need to blend it with other feed sources to dilute the nitrate concentration. For dry hay in bales, the nitrate concentration will not change in storage; use a hay probe to obtain the best possible feed sample. For silage, the nitrate concentration may decrease 20 to 50% during fermentation, so a fresh sample is necessary before feeding.

IMPORTANT: Many crop protection products have grazing restrictions on their labels that dictate if or when a crop treated with a product can be fed to livestock. Before using or selling a crop for livestock feed, check all labels of crop protection products that have been used on the crop this season. This includes seed treatments, herbicide applications, fungicide applications, and insecticide applications.

AGVISE Laboratories offers next-day turnaround for feed nitrate analysis. Rapid turnaround on nitrate analysis is important for producers debating to cut and bale or graze small grains or corn as livestock feed.  We also provide livestock water analysis, which includes total dissolved solids, nitrate, and sulfate, to assess livestock drinking water quality. Please call AGVISE staff in Northwood, ND (701-587- 6010) or Benson, MN (320-843-4109) with questions about nitrate, feed and hay quality, or water analysis. We can send you sampling supplies if needed.

AGVISE Laboratories Online Supplies Store

Helpful resources on using drought-stressed crops for livestock feed:

Nitrate Poisoning of Livestock (NDSU)

Using Drought-Stressed Corn as Forage (SDSU)

Drought-Related Issues in Forage, Silage and Baleage (Univ. of Missouri)

Potassium and Drought: A Two-fold Water Uptake Problem

Potassium is back on the radar for many farmers and agronomists across the upper Midwest and northern Great Plains. In the past two weeks, corn growth and development have reached the stage where potassium deficiencies are becoming quite apparent, and widespread dry soil conditions during the 2021 drought have worsened the problem. In some instances, corn is displaying potassium deficiency symptoms on soils with medium to high soil test K (120 to 180 ppm) in spite of potassium fertilizer application.

Potassium is required in large quantities for plant growth and development. The plant tissue K range in normal corn plants is 3-5% K, which is similar to nitrogen. A 200-bushel/acre corn crop will typically uptake 200 lb N, 108 lb P2O5, and 280 lb K2O per acre through the growing season (IPNI, 2014). In other words, an actively growing corn crop takes a lot of potassium! Luckily, you do not have to apply all that potassium as fertilizer, and much will come from the plant-available K pool in the soil.
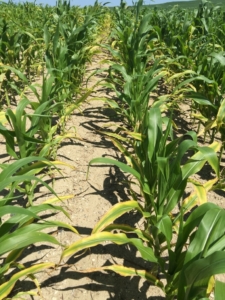
Potassium deficiency in corn. Symptoms are leaf chlorosis (yellowing) and necrosis (death) beginning at the leaf tip and outer leaf margin and progressing toward the midrib, often with wavy leaf edges. Potassium is mobile in the plant, so symptoms appear on the lower leaves first as the plant remobilizes potassium from lower leaves to support new plant growth. 

Drought reduces potassium availability

The plant-available K pool becomes less available when soil water is limited. This has become the top story as the 2021 drought has continued. Plant roots acquire potassium mostly through a process called diffusion. Diffusion is the slow movement of ions through water around soil particles to the plant root for uptake. As soil becomes drier, the thickness of the water film around soil particles becomes thinner and thinner, thus the diffusion path for potassium ions becomes longer and longer. The soil pore space becomes mostly air with little water remaining. This ultimately slows the rate at which potassium from soil or fertilizer can reach the plant root, and potassium deficiency may occur.

The consequence of the drought-induced potassium deficiency is two-fold because potassium also plays an essential role in plant water regulation. Potassium-stressed plants experience reduced photosynthesis and transpiration rates, resulting in poor water use efficiency of the already limited soil water that is available. In a nutshell, low soil water content reduces potassium availability from soil and fertilizer, and then the soil water that is there is poorly utilized because of the lack of potassium. In addition to limited soil water, other factors compound to reduce potassium uptake: soil test K, soil texture, clay mineralogy, soil compaction, and even fluffy soil syndrome.

Believe it or not, fluffy soil syndrome has been a component of more than one phone call concerning potassium deficiency. Do you see greener plants near the planter wheel tracks or sprayer tracks? Fluffy soil syndrome occurs when soil has not completely settled since spring tillage, which results in poor soil particle-to-particle contact and slow soil-water-root diffusion routes for potassium ions. The wheel tracks adequately firmed the soil to provide good soil particle-to-particle contact, maintaining better potassium diffusion.

Potassium deficiency in corn: A case study

In June 2021, AGVISE started to receive plant and soil samples to diagnose suspected potassium deficiencies in various crops. This corn example from west central Minnesota included plant and soil samples collected in the good and poor areas of the field. The leaf K concentration was 0.59% in the good and 0.52% in the poor area. For comparison, the corn leaf K sufficiency range at this growth sage should be 2-3% K. The corresponding soil samples had soil test K at 148 ppm in the good and 140 ppm in the poor area. The soil test K critical level for corn is 150-200 ppm, and the farmer had applied 50 lb/acre K2O broadcast + incorporation, which is very close to the university sufficiency guideline for corn. Although the farmer more or less did everything right for a normal rainfall year, drought conditions have reduced potassium availability to the point where potassium deficiency symptoms were apparent and visible.

One week after the plant and soil samples were collected, the field received an inch of rain, and the potassium deficiency symptoms disappeared! The entire corn field is green now. It is amazing what a little water will fix.
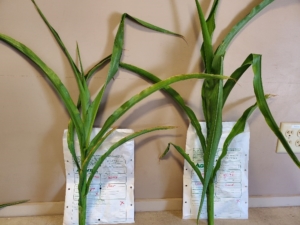
Potassium deficiency in corn confirmed with plant and soil analysis. Potassium-deficient corn plant (left) displays chlorosis and necrosis of the outer leaf margin and wavy leaf edge. Plant and soil samples were collected June 2021 in west central Minnesota.

Correcting the problem

So, what do you do next? Do you try to apply an in-season rescue potassium fertilizer application? You still need rain to water in any fertilizer applied to the soil surface. If you had applied an adequate amount of potassium fertilizer before planting, then the appropriate decision is to wait for rain to improve soil and fertilizer potassium availability. However, some people may not have applied enough potassium initially. In these cases, a rescue application of 60 lb/acre K2O broadcast (100 lb/acre potash, 0-0-60) followed by some rain should correct the symptoms. Do not skimp with anything less because you are already behind the eight-ball and you will need that much material to cover the soil surface adequately and affect enough individual corn plants. In NDSU research (2014-2016), an uncorrected potassium deficiency in corn could cost 20-30 bushel/acre compared to corn receiving adequate potassium fertilizer.

For liquid materials, potassium acetate and potassium thiosulfate could be dribbled between the rows, but the potassium rate will need to be similar to the dry potassium fertilizer rate and cost will likely be greater. Remember, potassium is something required in large quantities, not something corrected with a small application of 5-10 lb/acre K2O.

There is no way we could have planned for the very dry conditions that are exacerbating potassium deficiency symptoms across the region. For the future, the best preventative strategy is precision soil sampling (grid or zone) and fertilizing accordingly. It is important to identify and address those parts of fields where potassium may be limiting crop yield potential and spend fertilizer dollars where needed.

Sidedress Corn Using the Pre-sidedress Soil Nitrate Test (PSNT)

As the corn crop begins to emerge, it is time to prepare for sidedress nitrogen applications. Sidedress nitrogen for corn can be applied any time after planting, but the target window is generally between growth stages V4 and V8, before rapid plant nitrogen uptake occurs. Split-applied nitrogen has become a standard practice in corn to reduce in-season nitrogen losses on vulnerable soils, such as sandy and clayey soils. More and more farmers now include topdress or sidedress nitrogen as part of their standard nitrogen management plan. These farmers have witnessed too many years with high in-season nitrogen losses through nitrate leaching or denitrification.

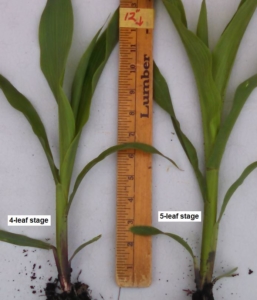
The target timing for PSNT sampling is when corn is 6 to 12″ tall. Twelve-inch corn is often V4 or V5 (like in the picture above). Do not hesitate in collecting soil samples for the PSNT; the target window for sidedress-nitrogen applications in corn is between the V4 and V8 stages. 

Whether your nitrogen management plan includes a planned sidedress nitrogen application or not, the Pre-Sidedress Soil Nitrate Test (PSNT) is one tool to help make decisions about in-season nitrogen. You may also hear this test called the Late-Spring Soil Nitrate Test (LSNT) in Iowa. PSNT is an in-season soil nitrate test taken during the early growing season to determine if additional nitrogen fertilizer is needed. PSNT helps assess available soil nitrate-nitrogen prior to rapid plant nitrogen uptake and the likelihood of crop yield response to additional nitrogen.

The Pre-sidedress Soil Nitrate Test (PSNT), taken when corn is 6 to 12 inches tall, can help you decide the appropriate sidedress nitrogen rate. The PSNT requires a 0-12 inch depth soil sample taken when corn plants are 6 to 12 inches tall (at the whorl), usually in late May or early June. Late-planted corn may not reach that height before mid-June, but PSNT soil samples should still be collected during the first two weeks of June. The recommend soil sampling procedure requires 16 to 24 soil cores taken randomly through the field, staggering your soil cores across the row as you go. All soil cores should be placed in the soil sample bag and submitted to the laboratory within 24 hours or stored in the refrigerator.

You can submit PSNT soil samples using the online AGVISOR program by choosing the “Corn Sidedress N” crop choice and submitting a 0-12 inch soil sample for nitrate analysis. AGVISOR will generate sidedress nitrogen fertilizer guidelines, using the PSNT critical level of 25 ppm nitrate-N (0-12 inch depth). If PSNT is greater than 25 ppm nitrate-N, then the probability of any corn yield response to additional nitrogen is low. If spring rainfall was above normal, then the PSNT critical level of 20 to 22 ppm nitrate-N (0-12 inch depth) should be used. Iowa State University provides additional PSNT interpretation criteria for excessive rainfall, manured soils, and corn after alfalfa.

If the PSNT is taken after excessive rainfall, the soil cores will be wet and difficult to mix in the field. Therefore, it is best to send all soil cores to the laboratory to be dried and ground, ensuring a well-blended soil sample for analysis. Although in-field soil nitrate analyzers have improved over the years, the difficult task of blending wet, sticky soil cores in the field still remains. The only way to get accurate, repeatable soil analysis results is to dry, grind, and blend the entire soil sample in the laboratory before analysis. AGVISE provides 24-hour turnaround on PSNT soil samples. The soil samples are analyzed and reported the next business day after arrival. Soil test results are posted on the online AGVISOR program for quick and easy access. With AGVISE, you get not only great service but also the highest quality data with four decades of soil testing experience.

Pre-Sidedress Soil Nitrate Test (PSNT) resources

Please call our technical support staff if you have any questions on PSNT and interpreting the soil test results for sidedress nitrogen application.

Starter Fertilizer: Choosing the Right Rate

Starter fertilizer placed with or near the seed is essential for vigorous early season growth in grass crops such as corn and wheat. We plant these crops early because we know vigorous early season growth is important to achieving high crop yields. Early planting also means cold soils, and starter fertilizer is necessary to get the crop going with a good start. Each spring, we receive many questions about starter fertilizer placement and seed-safe fertilizer rates. These questions come from farmers who want to plant as many acres per day as possible, take advantage of more efficient banded phosphorus placement, and of course reduce fertilizer costs.

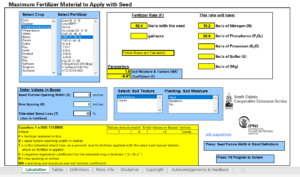
The two most common questions we get are “What is highest rate of starter fertilizer I can apply with the seed?” and “What is the lowest rate of starter fertilizer I can apply with the seed and still get a starter effect?” South Dakota State University (SDSU) made a downloadable spreadsheet that calculates the maximum seed-safe fertilizer rate (Figure 1). The spreadsheet will ask for the crop choice, fertilizer product, seed opener width, row spacing, tolerable stand loss, soil texture, and soil water content. The spreadsheet calculations are based on SDSU greenhouse and field studies.

Seed Safety Calculator from SDSU for Starter Fertilizer Article

Figure 1. Fertilizer Seed Decision Aid from South Dakota State University. Download the spreadsheet here

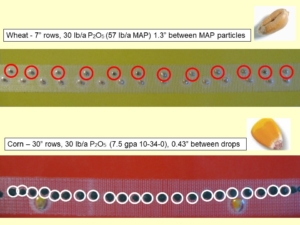
Research has shown, that to achieve the full starter effect, a fertilizer granule or droplet must be within 1.5 to 2.0 inches of each seed. If the fertilizer granule or droplet is more than 1.5 to 2.0 inches away from the seed, the starter effect is lost. To illustrate the role of starter fertilizer rates and seed placement, AGVISE put together displays showing the distance between fertilizer granules or droplets at various rates and row spacings. For example, take a look at wheat planted in 7-inch rows with 30 lb/acre P2O5 (57 lb/acre 11-52-0) and corn planted in 30-inch rows with 30 lb/acre P2O5 (7.5 gal/acre 10-34-0). You need to maintain a sufficient starter fertilizer rate to keep fertilizer granules or droplets with 1.5 to 2.0 inches of each seed.

Starter fertilizer demonstration example for starter fertilizer article

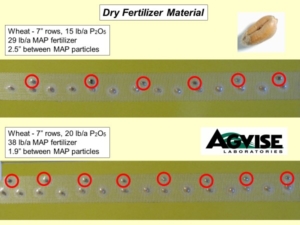
Figure 2. Two examples from the AGVISE Starter Fertilizer Display series. Find more crops and fertilizer rates here.

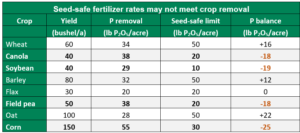
In the northern Great Plains and Canadian Prairies, most fertilizer is applied at planting and often as seed-placed fertilizer. This creates a challenge to prevent soil nutrient mining when balancing seed safety and crop nutrient removal with higher crop yield potential. Soil nutrient mining occurs when you apply less fertilizer than crop nutrient removal, resulting in soil test P and K decline over time. Some broadleaf crops, like canola and soybean, are very sensitive to seed-placed fertilizer, allowing only low seed-placed fertilizer rates. In contrast, most cereal crops can tolerate higher seed-placed fertilizer rates. To maintain soil nutrient levels across the crop rotation, you need to apply more phosphorus fertilizer in crops that allow greater seed safety. You can apply more phosphorus fertilizer with crops like corn or wheat, which allows you build soil test P in those years, while you mine soil test P in canola or soybean years. If you cannot the maintain crop nutrient removal balance with seed-placed fertilizer, then you need to consider applying additional phosphorus in mid-row bands or broadcast phosphorus at some point in the crop rotation.

Table 1. Seed-safe fertilizer rates may not meet crop removal. In the example, the seed-safe limit is based on 1-inch disk or knife opener and 7.5-inch row spacing for air-seeded crops and 30-inch row spacing for corn. Phosphorus (P) balance: Seed-safe limit (lb/acre P2O5) minus crop P removal (lb/acre P2O5). A negative P balance indicates the seed-safe limit does not meet crop removal, which may decrease soil test P.

Starter fertilizer is an important part of any crop nutrition plan. Here are more resources to help you make the best decisions on starter fertilizer materials, placement, and rates.

Fertilizer Application with Small Grain Seed at Planting, NDSU

Safe Rates of Fertilizer Applied with the Seed, Saskatchewan Agriculture

Using banded fertilizer for corn production, University of Minnesota

Corn response to phosphorus starter fertilizer in North Dakota, NDSU

Wheat, barley and canola response to phosphate fertilizer, Alberta Agriculture

Starter Fertilizer Display: How low can YOU go?

When profits are squeezed, more farmers are asking about optimal starter fertilizer rates and how low starter fertilizer rates can be. These questions are the result of wanting to keep fertilizer costs down, to plant as many acres per day as possible, and to take advantage of more efficient, lower rates of banded phosphorus fertilizer compared to higher rates of broadcast phosphorus fertilizer.

To illustrate the role of starter fertilizer rates and seed placement, we put together displays showing the distance between fertilizer granules or droplets at various rates and row spacings. You can see several pictures with canola, corn, soybean, sugar beet, and wheat. We greatly thank John Heard with Manitoba Agriculture for helping with the displays.

The displays show the normal seed spacing for several crops with different dry or liquid fertilizer rates alongside the seed. These displays help visualize the distance between the seed and fertilizer at several rates. University research shows that to achieve the full starter effect, a fertilizer granule or droplet must be within 1.5-2.0 inches of each seed. If the fertilizer granule or droplet is more than 1.5-2.0 inches away from the seed, the starter effect is lost. Some people wonder about these displays, but you can prove it to yourself pretty easily. Just run the planter partially down on a hard surface at normal planting speed. You will see what you imagine as a constant stream of liquid fertilizer, ends up being individual droplets at normal speed, especially with narrow row spacings and lower fertilizer rates.

These displays help illustrate the minimum starter fertilizer rate to maintain fertilizer placement within 1.5-2.0 inches of each seed for the full starter effect. In addition to an adequate starter fertilizer rate, additional phosphorus and potassium should be applied to prevent nutrient mining, causing soil test levels to decline in years when minimum fertilizer rates are applied.