Zone Soil Sampling: How Many Zones?

Zone soil sampling has become a standard practice in precision nutrient management, but the grand question remains – How many zones should you be soil sampling?

Well, it depends! It just makes sense that a field with more variability requires more zones than a field with little variability. Zone soil sampling separates parts of fields that behave differently into similar zones that can be managed together. Common data layers used to build zone soil sampling maps include satellite imagery, plant vegetation indices, crop yield, salinity, topography, and even bare soil color.

As a soil testing laboratory, AGVISE does not know what data layers are used to create the zone maps, but we do know the soil nutrient levels in each zone. Clients often ask how many zone soil samples should be collected in each field to get the best soil nutrient information. Common sense tells us that splitting fields into more zones should provide more detailed soil nutrient data.

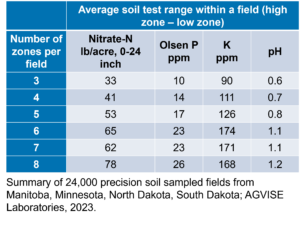
With soil test data from thousands of zone soil sampled fields, we mined the AGVISE database to see what the average range in soil test levels per field (high testing zone minus low testing zone) could tell us about field variability and the number of zones that should be sampled. The table summarizes the average range in soil test levels for over 24,000 zone soil sampled fields in 2023. The number of zones ranges from 3 to 8 zones per field. You can see, as the number of zones increases, the difference between the high zone and low zone gets larger and larger.

This data reminds us that more zones per field can tell us more about the soil nutrient status in each field, providing more powerful information to develop variable-rate fertilizer applications. If you have variable landscapes with rolling topography, diverse soil types, or salinity problems, you may have to take more zone soil samples per field (5-7 zones) to see the greatest differences in soil fertility and to take full advantage of variable-rate fertilizer applications. If your landscapes have less variability with fewer soil types, relatively flat topography, and no salinity problems, then you can probably take fewer zone samples per field (3-4 zones).

Zone Soil Sampling and Variable Rate Fertilization: Optimizing profits

This article originally appeared in the AGVISE Laboratories Winter 2022 Newsletter

Farmers, like all business owners, are profit maximizers: things are good when revenue exceeds cost. Things are even better when the difference between revenue and costs is substantial. The math behind increasing profit is simple: reduce costs, increase revenue. But, the difficult part is finding and implementing strategies on the farm to do this. Why not start with fertilizer, which is typically the largest annual input cost on the farm?

Your fields are variable. You know the hilltops have lower crop yields than the mid-slopes, and you know exactly how far the saline spots creep into the more productive part of the field. So why use the same rate of fertilizer in the unproductive areas as you would in the productive areas? Optimize your fertilizer inputs by reducing rates in low-yielding areas and reallocate those fertilizer dollars to the productive ground.

The North Field Zone Map

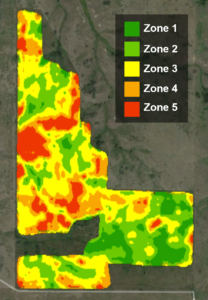
Figure 1. North Field zone map, created using ADMS from GK Technology.

How does one actually do this? Creating zone maps for your fields, soil sampling and testing based on productivity zones, and variable rate (VRT) fertilizer application is the place to start. Applying VRT fertilizer allows you to apply fertilizer where it is needed and not waste fertilizer dollars where it is not. Let me show you an example from my family’s farm in western North Dakota.

I farm with my dad and brother in southwest North Dakota. This past fall, I created zone maps for each of our fields, with help from GK Technology and their ADMS program. The final maps are based on historical satellite imagery. I will show you one of our fields, the North Field, and take a deep dive on nitrogen fertilizer optimization using zone soil sampling and VRT fertilization in the dryland “out west” country.

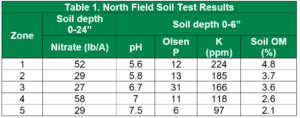
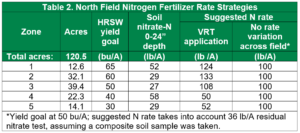
The North Field (Figure 1) is variable. That is expected on a 120-acre field with many hills and ravines (Table 1). For discussion, we will use residual soil nitrate-nitrogen results and make a nitrogen fertilizer plan using urea for hard red spring wheat (HRSW) in 2022. You can see the soil nitrogen data, crop yield goals, and final nitrogen rates in Table 2.


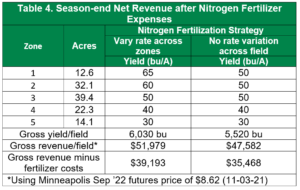
The first place to optimize fertilizer inputs is setting realistic crop yield goals for each zone. Spring wheat yield goals range from 65 bushel/ acre in the best zone (zone 1) to 30 bushel/acre on the hilltops (zone 5). Adjusting the nitrogen rate for the proper crop yield goal ensures that the high-producing zones are not limited by lack of nitrogen (increased fertilizer cost, increased revenue) and the low-producing zones are not overfertilized (decreased fertilizer cost, same revenue). With a responsible crop yield goal on the low-producing zones, the crop still receives the amount of nitrogen it requires, and excess nitrogen is not lost to nitrate leaching (wasted input cost). As a result, the excess nitrogen fertilizer is reallocated to high-producing zones, resulting in more crop yield with the same total fertilizer budget, and increased revenue.

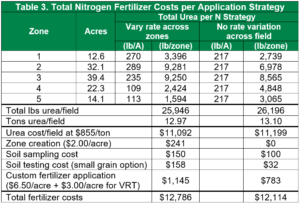
The nitrogen fertilizer scenarios in Tables 3 and 4 break down the projected revenues and expenses, demonstrating the benefits of zone soil sampling and VRT fertilization. For the North Field on my farm, the projected profit increase was $3,725 for the field or $31.05 per acre. It is tough to argue with a dollar amount like that! Prices will vary, of course, for fertilizer and precision ag services in your geography. Do the math for yourself and see how zone soil sampling and VRT fertilization can maximize profits for you.

Soil Testing and 4R Nutrient Stewardship

Each year, farmers aim to increase agricultural production and profitability while conserving our land resources for the next generation. These tandem goals drive sustainable soil fertility and crop nutrition decisions on cropland across the world.

In 2005, global fertilizer industry and environmental stakeholders began developing a standard theme to emphasize science-based stewardship in soil fertility and crop nutrition. The theme eventually became known as 4R Nutrient Stewardship, where each “R” referred to the “right” way to manage nutrients for crop production. The 4Rs are summarized as managing crop nutrition with the 1) Right Source, 2) Right Rate, 3) Right Time, and 4) Right Place.

To successfully implement 4R Nutrient Stewardship, you must start with a high-quality soil sample and an informative soil test. To begin, the fertilizer need and amount is determined through soil testing, which is based on regionally calibrated soil test levels for each crop. If you do not have a soil test, how do you know what the Right Rate is? Using crop removal rates or simply guessing without soil testing often leads to overapplication of fertilizer, cutting into profit.

A conventional whole-field composite soil sample (one soil sample per field) is certainly better than no soil sample. It gets you in the ballpark, but it does not detect variation in soil nutrient levels across the field. You might underapply fertilizer on high yielding parts and overapply fertilizer on low yielding parts. To get the Right Rate applied in the Right Place, precision soil sampling, either grid or zone, is the best way to determine the appropriate fertilizer rate and where to apply it in each field. Precision soil sampling is a proven tool to reduce over- and under-fertilization across fields, thus optimizing crop yield and profitability while reducing the potential risk of soil nutrient loss to the environment.

When you start soil sampling and making soil fertility plans for next year, keep 4R Nutrient Stewardship in mind. AGVISE Laboratories is a proud 4R Partner. To learn more about the 4Rs or become a 4R Partner, visit the 4R Nutrient Stewardship website.

Field Variability Screaming in Your Ear? Precision Soil Sampling is the Answer

Your land is variable. Each fall, you watch the combine yield monitor go up and down across the field. You know where crop yield will be the best in wet years and dry years. So, why do you still use a whole-field composite soil test to manage fertilizer inputs and ignore the obvious field variability affecting crop yield potential?

Precision soil sampling, using grids or zones, divides whole fields into smaller units for soil sampling and creates more accurate and useful soil test information. It tells you exactly where you need to apply more or less fertilizer within each field, unlocking untapped crop yield potential and fertilizer input savings. Grid soil sampling, which is the most detailed approach, typically breaks a field into 2.5- to 5.0-acre grid cells. The more adaptable approach is zone soil sampling, which divides the field into productivity zones that can be managed to their needs. A well-designed zone should represent the smallest practical management unit that still accurately represents the area (e.g. 20-40 acres). Zones are commonly created using data layers such as crop yield, satellite imagery, soil survey, topography, salinity, drainage, or a combination of several data layers.

Precision soil test data can reveal previously unknown production problems, which were otherwise masked in a whole-field composite soil sample. For example, more zone soil sampling has uncovered more and more low soil pH zones (below pH 6) in the long-term no-till areas of central South Dakota, southwest North Dakota, and north-central Montana. Previously, the whole-field composite soil sample had blended the low and high soil pH zones together and everything looked okay. But now, the zone soil samples are revealing where low soil pH is causing serious crop yield loss and where soil pH can be corrected with lime to improve crop yield. This is a good example of precision soil sampling revealing a long-hidden problem and showing us how to fix it.

If you break a field into smaller and smaller units (i.e. more zones), you will learn more and more about field variability. To illustrate the concept, we pulled soil test data from 23,000 zone sampled fields in 2020 and calculated the average soil test range (difference) between the high and low zones within each field. The summarized data is presented in the table.

Average soil test range within a field (high zone – low zone)
Number of zones per field Nitrate-N

lb/acre, 0-24 inch

Olsen P

ppm

K

ppm

pH Soil organic matter

%

3 27 9 88 0.57 1.10
4 38 14 108 0.76 1.52
5 45 17 137 0.89 1.73
6 55 21 164 1.12 1.68
7 61 23 184 1.25 1.59
8 65 24 183 1.26 2.04

As the number of zones increases in a field, the range in soil test values (high zone – low zone) also increases and highlights the true variability across the field. The trend is clear not just for soil nutrients like nitrogen, phosphorus, and potassium, but also for soil properties like pH and organic matter. This tells us that one whole-field “average,” was missing the highs and lows that occur naturally in many fields.

Precision soil sampling is the first step in understanding what is really happening in your fields. You can gain a clearer picture of what plant nutrient deficiencies might be occurring and where you can improve crop yield potential. The next step is creating variable-rate prescriptions for seed, fertilizer, lime, and even herbicides (consider soil pH and organic matter). These tools can help you improve crop yield, optimize crop inputs, and increase profitability within each field on your farm.