Early Summer Grid Soil Sampling

The interest in early summer topsoil grid sampling (1.0- to 2.5-acres per grid) continues to increase, especially in traditional corn-soybean growing areas. In Minnesota alone, 30-40% of all grid soil samples are now collected in the summer months. The early summer period (late May to late June) is an excellent period of time to collect grid soil samples, instead of waiting until after soybean harvest when workload and time constraints are heavier.

These early summer soil samples are collected from unfertilized soybean fields, and the soil samples are collected when the soybean plants are in early vegetative growth stages while you can travel across soybean fields with ATVs or UTVs without causing unnecessary damage. These are fields that would have been fertilized two years prior ahead of corn planting, and the fertilizer rates were high enough to cover the following soybean crop as well.

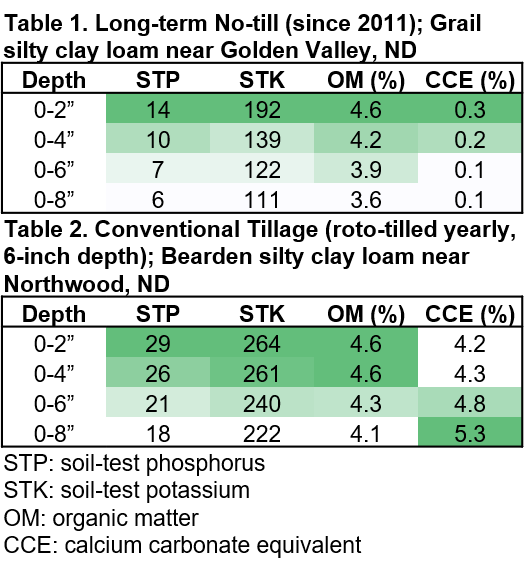
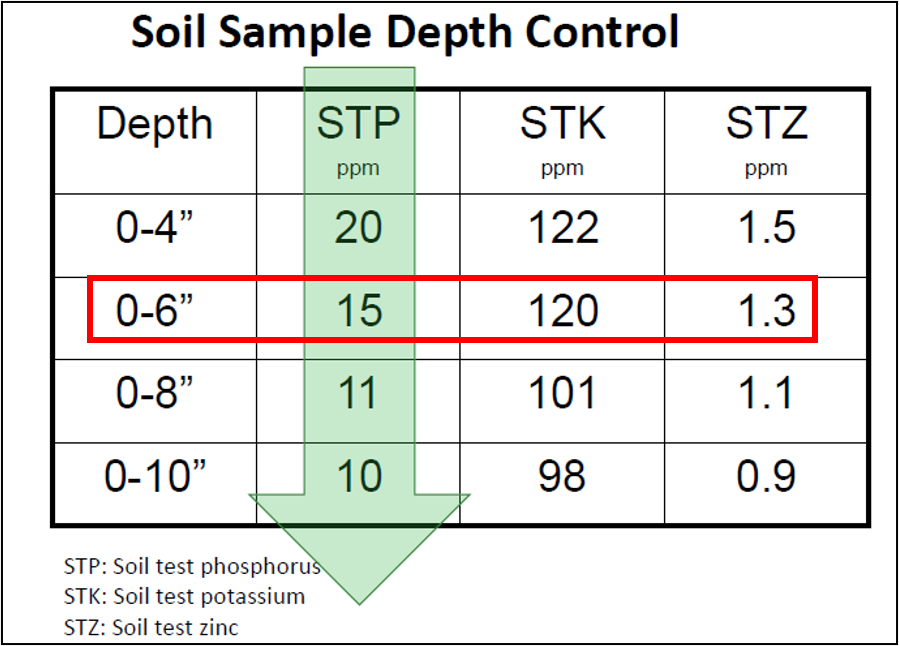
The early summer timeframe works well for 0-6 inch soil sampling and analyzing non-mobile nutrients and soil properties. The commonly tested nutrients and soil properties are P, K, Ca, Mg, Na, B, Cu, Fe, Mn, Zn, pH, buffer pH, salts, organic matter, carbonate (CCE), CEC, and base saturation. It is not applicable for 2-ft residual nitrate-N testing, which must wait until after the crop has been harvested. The mobile soil nutrients like nitrate-N, sulfate-S, and chloride should wait for fall soil sampling.

Advantages to early summer grid soil sampling

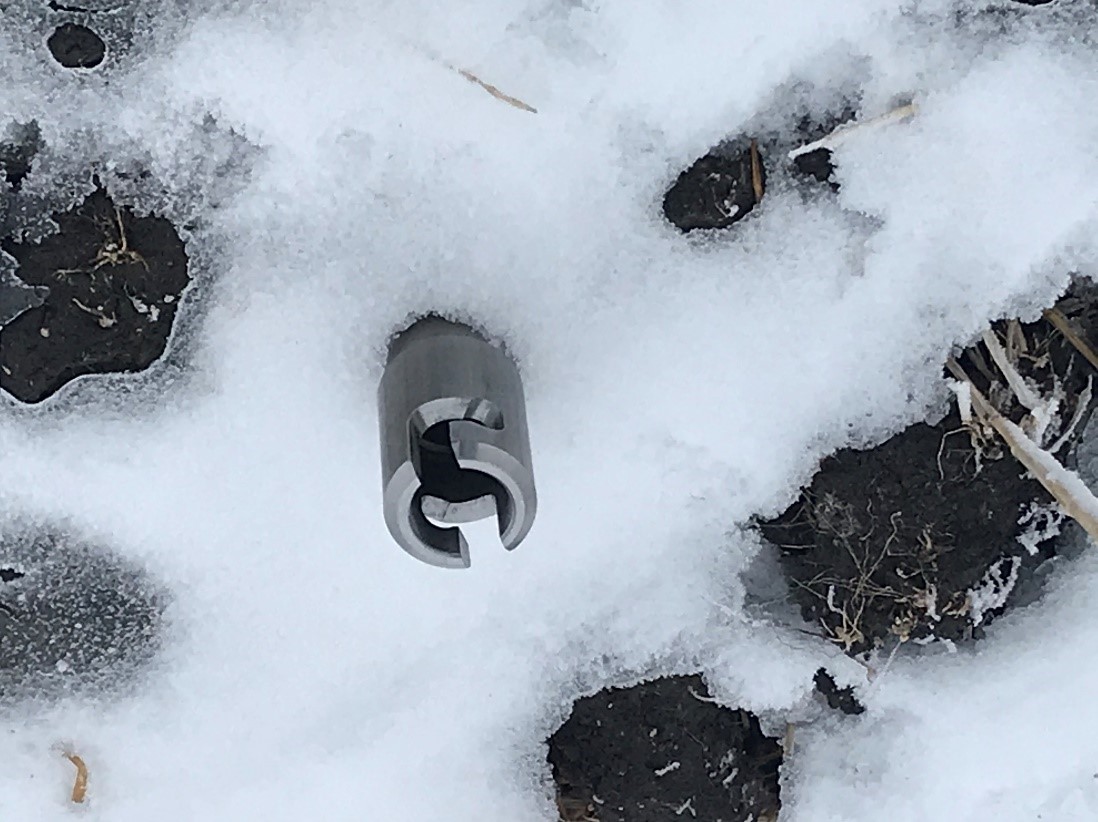
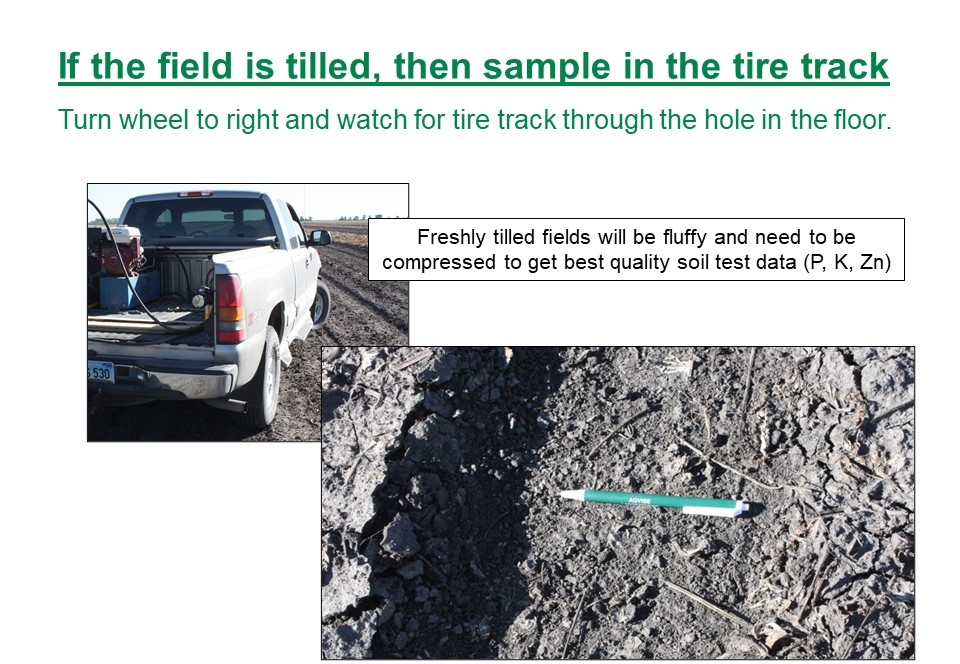
  • High-quality soil cores with consistent depth (moist and firm soil profile)
  • No more chasing around in the fall trying to soil sample fields that have been harvested and before any fall tillage occurs
  • More time in summer to develop fertilizer management plans with growers
  • Fields can be fertilized immediately after harvest
  • Avoid post-harvest soil sampling rush in the fall
  • More available labor (interns) in the summer timeframe compared to the fall season
  • On-ground assessment of soybean stands, especially if iron deficiency chlorosis (IDC) is observed

You will want to avoid soybean fields that have been fertilized or manured in the fall or spring prior, as the recent fertilizer or manure application can skew soil test results. In these situations, it is best to wait until after the soybean crop has been harvested to collect soil samples in the fall. In small grain production areas, if soybean or pulses will be planted next year (both crops not requiring nitrogen fertilizer), the early summer timeframe can also offer another opportunity to accomplish grid/zone sampling in the early vegetative growth stages of the small grain crop (barley, oat, wheat), just make sure to avoid any fertilizer bands (seed-row or mid-row fertilizer bands).

Soil Sensors: Helpful Gadgets or Hapless Gimmicks?

This article originally appeared in the AGVISE Laboratories Winter 2024 Newsletter.

A number of new handheld sensors have hit the market, claiming to accurately and precisely measure soil nutrient content in the field, similar to traditional wet chemistry analysis at a soil testing laboratory. The draw for any person soil sampling is the ability to receive soil analysis results right in the field in real time. We know that our clients have a lot of questions about these types of sensors because we are getting these questions too. For almost 50 years, AGVISE has been an early adopter and innovator of new technologies in soil and plant analysis, and these new soil sensors are among the newest to gain popular attention in agriculture.

First, handheld sensors in general are nothing new for soil analysis. There are a number of handheld pH and electrical conductivity (EC) sensors available on the market that are often used for assessing and mapping environmental sites for reclamation and remediation projects. The environmental consultants still need to collect field soil samples and send them to the laboratory for calibration and validation in their official reports. The handheld sensors are used to help them assess the site size and variability.

Second, the type of sensor for the intended soil nutrient or property for measurement is important. After all, you should not try to measure something that the sensor cannot detect, right? The new handheld soil nutrient sensors often rely on near-infrared (NIR), mid-infrared (MIR), or X-ray fluorescence (XRF) spectroscopy methods. These technologies have long existed as benchtop instruments in analytical laboratories for various applications, and each method has its strengths and limitations.

For example, NIR spectroscopy is widely used in feed and forage analysis, food processing, and even meat science. The American Society of Agronomy compiled an 800-page book on NIR applications in agriculture (https://doi.org/10.2134/agronmonogr44.c10). There is one chapter on soil analysis at the end of the book. The strengths of NIR for soil analysis include soil organic matter, total carbon, organic carbon, organic nitrogen, and even pH. However, it does not perform well for nitrate-N, P, K, sulfate-S, Ca, Mg, Na, Cu, Fe, Mn, Zn, or soluble salts (EC). Simply put, NIR fails at measuring the actual soil nutrients we are trying to manage! This is why we do not use benchtop NIR for any soil analyses at AGVISE, let alone a handheld unit with less accuracy or precision. You might see handheld NIR sensors being used for some things, but you will not see them replace soil sampling or soil nutrient analysis soon.

Third, the handheld sensor outputs are often correlated and converted, in the end, to traditional wet chemistry analysis methods, like Bray P, Olsen P, or ammonium acetate K. These are the plant-available soil test methods that we are all familiar with and have decades of soil test calibration research behind them, which allow us to make fertilizer guideline calculations from the soil test result. Whenever a correlation and conversion step takes place, this introduces error for any subsequent calculations, like fertilizer rates. It is important to know what is actually being measured versus what is being reported.

As new sensors hit the market, a person thinking about trying them should be asking a lot of questions. AGVISE is always evaluating new analysis technologies, which can help us do a better or faster job while providing high-quality data to our clients. The questions outlined above are those that we use when we evaluate new analysis technologies for our own operation, and we hope the same questions can help guide you through the gamut of new soil sensors too.

Sticky Wet Soils? Try Adding a WD-40 Holster

This article originally appeared in the AGVISE Laboratories Fall 2024 Newsletter.

Do you have challenges collecting good quality soil cores in sticky wet soils? You are not the only one! WD-40 has been the soil probe lubricant of choice for over 30 years to help obtain better quality soil samples. University researchers have also tested WD-40 and found it does not contaminate soil samples.

Spraying WD-40 on your soil probes with the spray cans can get messy inside the pickup cab. A smart idea to make the WD-40 application process simpler and cleaner is making a WD-40 holster with some PVC pipe. The PVC pipe holster lubricates the soil probe with WD-40 between each soil core and also keeps the soil probe within easy reach. The clever idea came from a client who had spent too much time fiddling with WD-40 spray cans and losing them underneath the pickup seat.

The WD-40 holster is made from 2-inch diameter PVC pipe with a cap glued on the bottom and a threaded fitting on the top with a screw-in plug for storage when not in use. The PVC pipe should be fastened so that the open end faces the soil sampler and the soil probe can be easily placed into the pipe. Fill the PVC pipe with about 3-4 inches of WD-40 in the bottom. With the PVC pipe opening near the hole in the pickup floor, any excess WD-40 drops coming off the soil probe will go down the hole and reduce the mess of spraying WD-40 in the pickup cab.

Zone Soil Sampling: How Many Zones?

Zone soil sampling has become a standard practice in precision nutrient management, but the grand question remains – How many zones should you be soil sampling?

Well, it depends! It just makes sense that a field with more variability requires more zones than a field with little variability. Zone soil sampling separates parts of fields that behave differently into similar zones that can be managed together. Common data layers used to build zone soil sampling maps include satellite imagery, plant vegetation indices, crop yield, salinity, topography, and even bare soil color.

As a soil testing laboratory, AGVISE does not know what data layers are used to create the zone maps, but we do know the soil nutrient levels in each zone. Clients often ask how many zone soil samples should be collected in each field to get the best soil nutrient information. Common sense tells us that splitting fields into more zones should provide more detailed soil nutrient data.

With soil test data from thousands of zone soil sampled fields, we mined the AGVISE database to see what the average range in soil test levels per field (high testing zone minus low testing zone) could tell us about field variability and the number of zones that should be sampled. The table summarizes the average range in soil test levels for over 24,000 zone soil sampled fields in 2023. The number of zones ranges from 3 to 8 zones per field. You can see, as the number of zones increases, the difference between the high zone and low zone gets larger and larger.

This data reminds us that more zones per field can tell us more about the soil nutrient status in each field, providing more powerful information to develop variable-rate fertilizer applications. If you have variable landscapes with rolling topography, diverse soil types, or salinity problems, you may have to take more zone soil samples per field (5-7 zones) to see the greatest differences in soil fertility and to take full advantage of variable-rate fertilizer applications. If your landscapes have less variability with fewer soil types, relatively flat topography, and no salinity problems, then you can probably take fewer zone samples per field (3-4 zones).

Winter Soil Sampling: You Need the Right Tools

Snowfall in late October and November slowed harvest and soil sampling across the region. This means some fields will be soil sampled in December and maybe January as harvest for late-season crops continues in the snow.

The right equipment is the key to any project, and winter soil sampling is no different. AGVISE heavy-duty (HD) chromoly soil probes were designed for hard, frozen soil conditions. Chromoly steel is much tougher than stainless steel, and it handles the stress of sampling frozen soil. To punch through several inches of frost, you will also require additional weight. Most soil sampling trucks have the hydraulic cylinder mounted inside the truck cab, where you can take advantage of the entire truck weight to push through the frost. This enables you to take soil samples through 4 to 6 inches of frost on most medium- and fine-textured soils in winter. For receiver hitch-mounted hydraulic cylinders, you will need to add extra weight in the truck box, and it may limit you to pushing through only 1 to 3 inches of frost.

AGVISE offers wet and dry soil probe tips for the HD chromoly soil probe. The wet soil probe tip is best suited for frozen soils. The HD chromoly soil probe is available with or without a slot.

You can view examples of in-cab and receiver hitch-mounted hydraulic soil sampling systems on our website (https://www.agvise.com/installed-soil-sampling-kit-examples/). You can also find videos of soil sampling in frozen soils with the HD chromoly soil probe and wet soil probe tip.

Sampling Depth: Be consistent!

This article originally appeared in the AGVISE Laboratories Fall 2022 Newsletter

Soil test results are only as reliable as the soil samples collected in the field. A crucial part of soil sample quality is consistent sampling depth. This is important because all the soil test calibration research and fertilizer guidelines for non-mobile nutrients (e.g., phosphorus, potassium, zinc) are based on a soil core depth of 0-6 inches, thanks to the historical tillage depth. If soil cores are taken too shallow or too deep, you can skew soil test values and the resulting fertilizer guidelines. Getting the most accurate and useful fertilizer guidelines starts with a good quality soil sample. To help illustrate this point, we did a simple demonstration project, showing how soil sampling depth consistency affects soil test results in a long-term no-till and conventional-till field.

Soil nutrient concentrations can vary greatly throughout a soil profile, even more so in long-term no-till where soil nutrients are not regularly mixed. This leads to stratification of nutrients near the soil surface, meaning a soil core that is too shallow or too deep can greatly affect soil test results. You can clearly see the effect of no-till stratification in soil test potassium (STK) levels in Table 1. Between the 0-2 and 0-4 inch soil cores, there is a 53 ppm difference in STK. Although nutrients in conventional tillage systems do not concentrate at the surface to the extent they do in no-till, a concentration gradient still exists. This is most obvious near the tillage depth, where soil mixing below that depth stops. In Table 2, the 0-2 and 0-4 inch soil test results are similar, but the differences become apparent at the 0-6 inch depth. Soil sample depth is just as critical in conventional tillage as it is in no-till. In addition, it is important to collect soil samples before any fall tillage occurs
to collect good quality soil cores with consistent depth. Tillage creates uneven clods and a “fluffy” soil surface, making it hard to determine what actually represents the 0-6 inch soil depth.

Tips to increase soil sample depth consistency

• Collect soil samples before any tillage occurs. If tillage does happen before you can take a soil sample, try to make a firm surface with your foot or sample in a tire track.

• If you are using a hand probe, mark the target soil core depth on the soil probe clearly. A metal file works great to cut a notch in the soil probe at 6 inches. The file mark does not wear away like a piece of tape or permanent marker can.

• If you are using a hydraulic probe and use your hand to measure the soil core length, calibrate often to ensure you are measuring a true 0-6 inch soil core.

• If you train new soil samplers, reiterate the importance of soil sampling depth consistency. Provide clear instructions on measuring the proper soil sampling depth in the field.

• Be sure the soil sample submission information sent to the laboratory (online or paper) matches the actual soil sample depth obtained in the field. The correct soil sample depth can be noted on the paper forms or edited on the AGVISOR online submission before it reaches the laboratory.


Soil Sampling for Nitrogen in a Delayed Spring

Spring planting is clipping along in some parts of the region, while other parts are still waiting to hit the field, as excessive rainfall and cold temperatures have delayed spring field work and planting. Who would have thought last fall that this is what spring 2022 would look like, after the worst region-wide drought in 30 years? Mother Nature always reminds us to stay prepared for anything.

A delayed spring start means that every day in the field is important. AGVISE delivers next-day turnaround on processing soil samples. The soil samples are analyzed and reported the next business day after arrival at the laboratory. Soil test results are posted to our online AGVISOR portal for quick and easy access. If you need any soil sampling supplies for spring, please let us know and we will send them to you right away.

So, what is the best strategy for spring soil testing and assessing soil nitrogen losses after the rain? The compressed fertilizer and planting window might not leave enough time to adjust preplant fertilizer rates, especially if the field is just barely dry enough to plant. If soil nitrogen losses have occurred following spring rains, a spring soil test collected now will be helpful to create a split-applied nitrogen plan or to direct a supplemental nitrogen application later. In the AGVISE Spring 2022 Newsletter, we answered some questions on split-applied nitrogen application strategies, so please take a look at those options for applying nitrogen during the growing season.

Short-season crops develop quickly, so additional nitrogen should be applied in the upcoming weeks. A soil sample collected before or shortly after planting will provide the best assessment of preplant soil nitrogen supply and losses. Do not wait too long to collect the soil sample because, as we move into June, plant nitrogen uptake and nitrogen mineralization from soil organic matter will make the soil nitrogen result more difficult to decipher. To maximize yield in small grains, apply all topdress nitrogen before jointing (5-leaf stage). Any nitrogen applied after jointing will mostly go to grain protein. In canola, apply nitrogen during the rosette stage, before the 6-leaf stage.

Long-season crops like corn offer more flexibility and time for in-season soil sampling and nitrogen application. Rapid nitrogen uptake in corn does not begin until after the V6 growth stage. The Pre-sidedress Soil Nitrate Test (PSNT) can help you decide the appropriate sidedress nitrogen rate. For more details, take a look at the PSNT article link for instructions on collecting and submitting PSNT soil samples. The PSNT requires a 0-12 inch depth soil sample taken when corn plants are 6 to 12 inches tall (at the whorl), usually in late May or early June. Late-planted corn may not reach that height before mid-June, but PSNT soil samples should still be collected during the first two weeks of June. If spring rainfall was above normal, Iowa State University guidelines provide additional PSNT interpretation criteria for excessive rainfall, manured soils, and corn after alfalfa.

If you have any questions on the best strategies for spring soil sampling and in-season nitrogen application options, please call our technical support team and we will be happy to answer any questions you may have.

Probe stuck in the ground? Don’t let it wreck your day.

If you have ever had a soil probe come off while in the ground, you have experienced a rare but stressful event!

A customer recently called with this situation and a success story about how he recovered the soil probe “MacGyver” style.  I think his solution involved barb wire, duct tape and some chewing gum.  While a soil probe with quicktatch collar can come off the roll pin on the cylinder shaft, it is very rare.  If you have had that happen to you, you may have used a shovel to dig the probe out or pulled it out with some other MacGyver device you created.  In the winter with frozen soil, your options are more limited.  We wanted to give others who may experience this rare event an idea to create your own “probe puller” if this happens to you.  The materials you need are an extra quicktatch collar, snap pin or small bolt, short chunk of light chain, and another bolt with two nuts.   Here are some pictures to show you the probe puller we “MacGyvered” with stuff laying around the shop (sorry no duct tape or chewing gum involved).  I am sure several of you may have come up with even simpler/better designs for this life-saving device.  We would love to see other designs to share with customers who need to create a device that will save the day for poor samplers who find themselves in this situation!

Zone Soil Sampling and Variable Rate Fertilization: Optimizing profits

This article originally appeared in the AGVISE Laboratories Winter 2022 Newsletter

Farmers, like all business owners, are profit maximizers: things are good when revenue exceeds cost. Things are even better when the difference between revenue and costs is substantial. The math behind increasing profit is simple: reduce costs, increase revenue. But, the difficult part is finding and implementing strategies on the farm to do this. Why not start with fertilizer, which is typically the largest annual input cost on the farm?

Your fields are variable. You know the hilltops have lower crop yields than the mid-slopes, and you know exactly how far the saline spots creep into the more productive part of the field. So why use the same rate of fertilizer in the unproductive areas as you would in the productive areas? Optimize your fertilizer inputs by reducing rates in low-yielding areas and reallocate those fertilizer dollars to the productive ground.

The North Field Zone Map

Figure 1. North Field zone map, created using ADMS from GK Technology.

How does one actually do this? Creating zone maps for your fields, soil sampling and testing based on productivity zones, and variable rate (VRT) fertilizer application is the place to start. Applying VRT fertilizer allows you to apply fertilizer where it is needed and not waste fertilizer dollars where it is not. Let me show you an example from my family’s farm in western North Dakota.

I farm with my dad and brother in southwest North Dakota. This past fall, I created zone maps for each of our fields, with help from GK Technology and their ADMS program. The final maps are based on historical satellite imagery. I will show you one of our fields, the North Field, and take a deep dive on nitrogen fertilizer optimization using zone soil sampling and VRT fertilization in the dryland “out west” country.

The North Field (Figure 1) is variable. That is expected on a 120-acre field with many hills and ravines (Table 1). For discussion, we will use residual soil nitrate-nitrogen results and make a nitrogen fertilizer plan using urea for hard red spring wheat (HRSW) in 2022. You can see the soil nitrogen data, crop yield goals, and final nitrogen rates in Table 2.


The first place to optimize fertilizer inputs is setting realistic crop yield goals for each zone. Spring wheat yield goals range from 65 bushel/ acre in the best zone (zone 1) to 30 bushel/acre on the hilltops (zone 5). Adjusting the nitrogen rate for the proper crop yield goal ensures that the high-producing zones are not limited by lack of nitrogen (increased fertilizer cost, increased revenue) and the low-producing zones are not overfertilized (decreased fertilizer cost, same revenue). With a responsible crop yield goal on the low-producing zones, the crop still receives the amount of nitrogen it requires, and excess nitrogen is not lost to nitrate leaching (wasted input cost). As a result, the excess nitrogen fertilizer is reallocated to high-producing zones, resulting in more crop yield with the same total fertilizer budget, and increased revenue.

The nitrogen fertilizer scenarios in Tables 3 and 4 break down the projected revenues and expenses, demonstrating the benefits of zone soil sampling and VRT fertilization. For the North Field on my farm, the projected profit increase was $3,725 for the field or $31.05 per acre. It is tough to argue with a dollar amount like that! Prices will vary, of course, for fertilizer and precision ag services in your geography. Do the math for yourself and see how zone soil sampling and VRT fertilization can maximize profits for you.

Soil Sample Before Tillage: Consistent sample depth matters!

The fall harvest season is a busy time of year. Farmers need to finish harvest, apply fertilizer, and complete any tillage operations before the long winter sets in. Another field operation that needs to be completed within this flurry of activity is soil sampling, and sampling timing is crucial to getting quality and consistent soil cores.

Do your best to soil sample fields before any tillage pass. Tillage makes collecting soil cores with consistent depths very difficult, which can affect test results. Soil test results are only as reliable as the soil samples that were collected from the field. If a sample is submitted as a 0 to 6-inch sample and is only really the top 0 to 4-inch of the soil, soil test values are inflated compared to actual 0 to 6-inch results. The opposite happens if a core is actually deeper than the 0 to 6-inch depth: soil test values are diluted if the sample that was submitted is deeper. The table below shows an example of how test levels of non-mobile nutrients like P, K, and Zn decrease as soil core length increases.

Why tillage affects sampling depth consistency and core quality

Tillage breaks apart soil and introduces air, essentially “fluffing” the soil. Sampling after the soil has been “fluffed” means the sampler has to guess what actually represents a 6-inch soil depth for that field. What was a 0 to 6-inch core in the soil probe before tillage might actually take up 8 inches in the soil probe now, given the soil profile is now “fluffy” after tillage. Over time the soil will settle, but when does that happen? How fast does that happen? When will 0 to 6 inches of tilled soil in the soil probe actually represent a 0 to 6-inch depth again? No one can accurately answer these questions.

Beyond the soil being “fluffy” after tillage, tillage loosens soil aggregates, makes clods, and generally dries the soil. This means loose soil may fall out of the probe or the probe pushes around the clods at the surface and does not get a true 0 to 6-inch sample. This might mean a core that’s collected and sent to the laboratory might actually be a 2 to 8-inch depth core, or a 2 to 6-inch depth core.

A tip for sampling after tillage

If you have to sample after tillage, sample in the wheel track. The tire compresses the soil and allows you to get a better opportunity at a true 0 to 6-soil core depth.

Getting consistent soil core depths is crucial. Sampling before tillage is the best thing you can do to ensure quality cores with consistent depths. Sampling after tillage can result in lower test levels for non-mobile nutrients like P, K, and Zn. Please call either AGVISE laboratory and ask for one of our technical support staff if you have any questions about sampling after a field has been tilled.