AGVISE Demonstration Project: Lowering Soil pH with Elemental Sulfur
This article originally appeared in the AGVISE Laboratories Spring 2025 Newsletter.
There may not be silly questions, but there are silly answers. Every so often, we get questions about unusual solutions to manage calcareous soils in the northern Great Plains and Canadian Prairies. The most frequent oddball “solutions” involve lowering soil pH with elemental sulfur on calcareous soils. Such suggestions might work on acidic soils; however, the dominant calcareous soils in the region have high pH (>7.3) and tons of natural calcium carbonate that make such attempts impractical and expensive. To put the nail in the coffin, AGVISE Laboratories started some long-term demonstration projects to show plainly why such ideas do not work or may cost way too much!
If possible, we’d like an easy and cheap solution to lower soil pH, like applying only 100 to 200 lb/acre elemental sulfur (S). In soil, elemental S oxidizes to sulfuric acid, which can lower soil pH. However, the large amount of calcium carbonate (free lime) keeps our soils buffered at high pH. To lower soil pH permanently, you must first react and neutralize the carbonate with elemental S before the soil pH can budge. With 100 lb/acre elemental S applied each year, that does not sound too difficult, right?

Elemental sulfur project with rates ranging from 0 to 40,000 lb/acre elemental sulfur. Can you identify the 20 ton/acre rate?
Not so fast. A soil with only 1% calcium carbonate equivalent (CCE) takes 3.2 ton/acre elemental S (6,400 lb/acre) to neutralize the carbonate alone in the 0-6 inch soil depth. In 2020, we started an elemental S project at Northwood, ND on soil containing 4.5% CCE, which would require literal tons of elemental S to lower soil pH. A previous project started in 2005 had used 10,000 lb/acre elemental S, but it was not enough to lower soil pH beyond pH 7.8 after 15 years. This time, we decided to get serious and use elemental S rates from 0 to 40,000 lb/acre (Figure 1). The elemental S rates were intended to hit above and below the target 30,000 lb/acre elemental S rate required to react and neutralize 4.5% CCE.
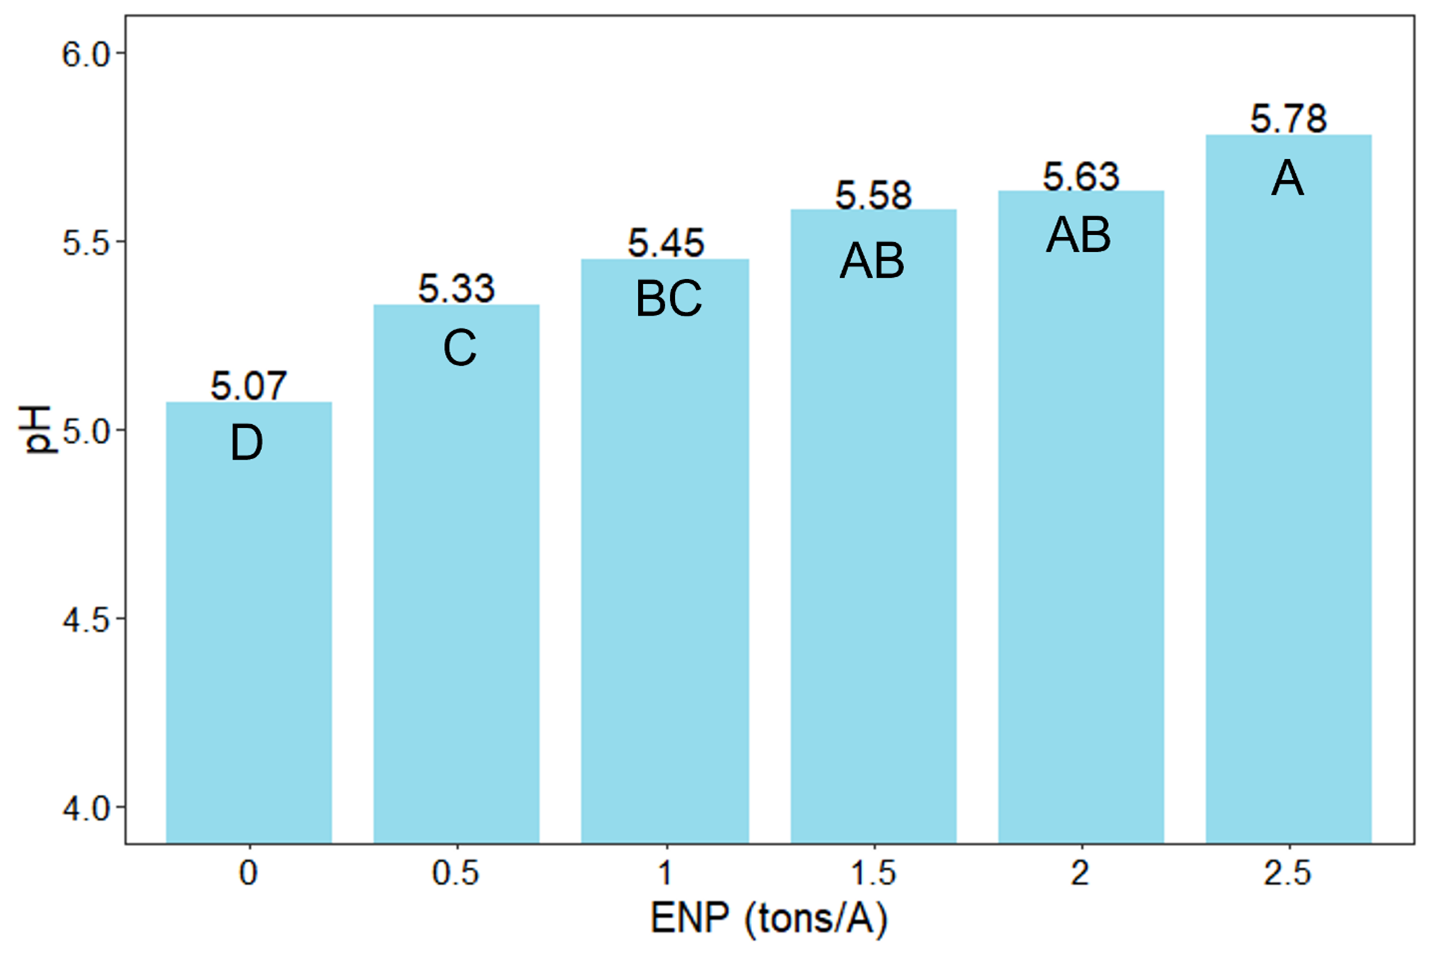
For the first three years of the project, we saw little to no change in soil pH, regardless of elemental S rate. The oxidation process that converts elemental S to sulfuric acid is a slow, biological process that can take a long time. In Fall 2024, we finally saw real changes in soil pH following elemental S application. The 16,000 lb/acre elemental sulfur rate reached pH 7.5. The 24,000 lb/acre elemental sulfur rate reached pH 7.0. The 40,000 lb/acre elemental sulfur rate reached pH 6.0, a dramatic change! The lowest 8,000 lb/acre elemental sulfur rate, however, was no different than the control.
 There is still some unoxidized elemental sulfur and unreacted calcium carbonate in the soil, and we will continue to monitor these long-term demonstration plots in future years. The project demonstrates that elemental sulfur can lower soil pH, but it also shows that the very high amounts of elemental sulfur required are both impractical and expensive. A few hundred pounds of elemental sulfur applied each year will get you nowhere. In contrast, the very high elemental sulfur rates will break the bank. This is why we consider such “solutions” as either ineffective attempts or downright silly wastes.