Soil Sensors: Helpful Gadgets or Hapless Gimmicks?
This article originally appeared in the AGVISE Laboratories Winter 2024 Newsletter.
A number of new handheld sensors have hit the market, claiming to accurately and precisely measure soil nutrient content in the field, similar to traditional wet chemistry analysis at a soil testing laboratory. The draw for any person soil sampling is the ability to receive soil analysis results right in the field in real time. We know that our clients have a lot of questions about these types of sensors because we are getting these questions too. For almost 50 years, AGVISE has been an early adopter and innovator of new technologies in soil and plant analysis, and these new soil sensors are among the newest to gain popular attention in agriculture.
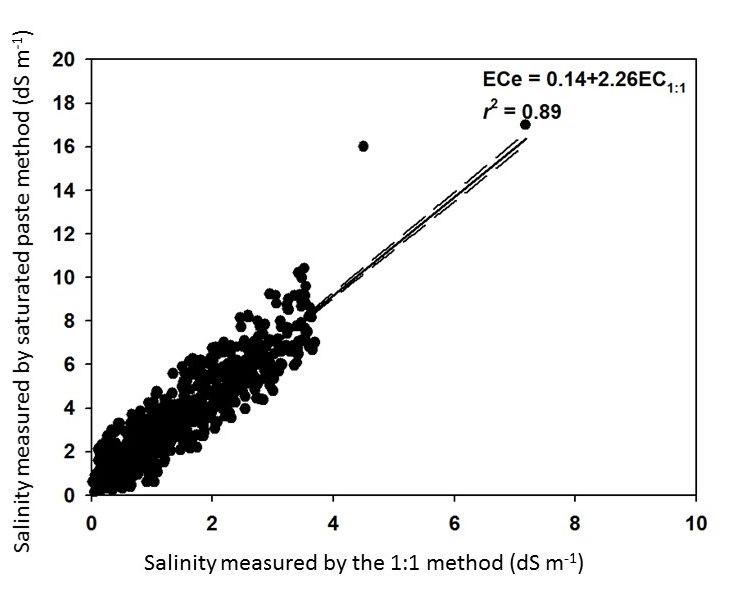
First, handheld sensors in general are nothing new for soil analysis. There are a number of handheld pH and electrical conductivity (EC) sensors available on the market that are often used for assessing and mapping environmental sites for reclamation and remediation projects. The environmental consultants still need to collect field soil samples and send them to the laboratory for calibration and validation in their official reports. The handheld sensors are used to help them assess the site size and variability.
Second, the type of sensor for the intended soil nutrient or property for measurement is important. After all, you should not try to measure something that the sensor cannot detect, right? The new handheld soil nutrient sensors often rely on near-infrared (NIR), mid-infrared (MIR), or X-ray fluorescence (XRF) spectroscopy methods. These technologies have long existed as benchtop instruments in analytical laboratories for various applications, and each method has its strengths and limitations.
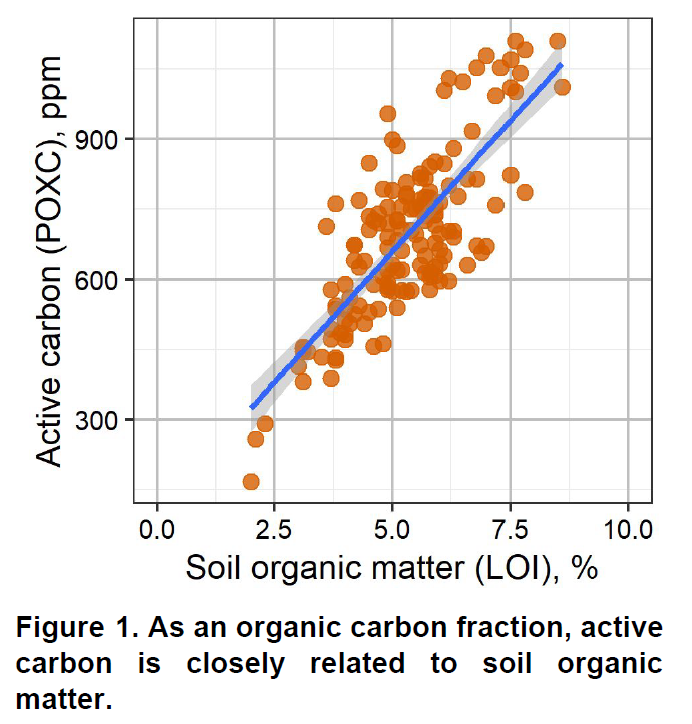
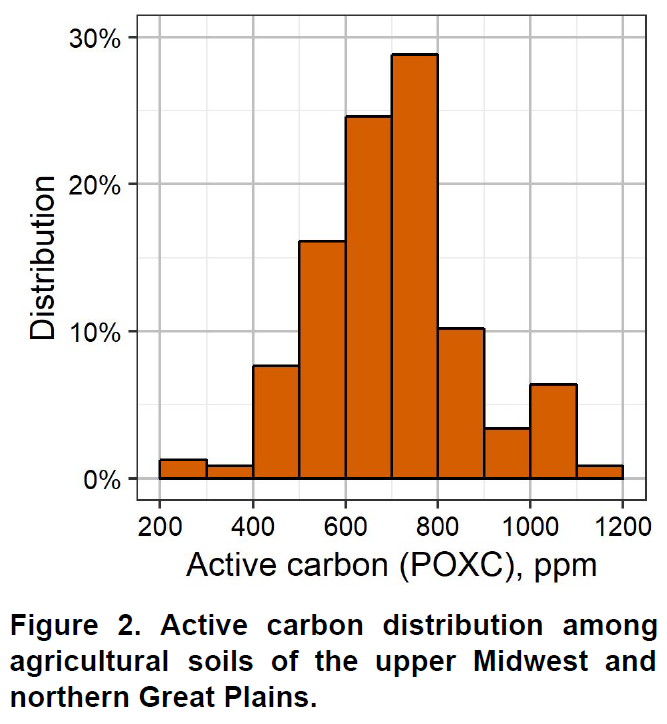
For example, NIR spectroscopy is widely used in feed and forage analysis, food processing, and even meat science. The American Society of Agronomy compiled an 800-page book on NIR applications in agriculture (https://doi.org/10.2134/agronmonogr44.c10). There is one chapter on soil analysis at the end of the book. The strengths of NIR for soil analysis include soil organic matter, total carbon, organic carbon, organic nitrogen, and even pH. However, it does not perform well for nitrate-N, P, K, sulfate-S, Ca, Mg, Na, Cu, Fe, Mn, Zn, or soluble salts (EC). Simply put, NIR fails at measuring the actual soil nutrients we are trying to manage! This is why we do not use benchtop NIR for any soil analyses at AGVISE, let alone a handheld unit with less accuracy or precision. You might see handheld NIR sensors being used for some things, but you will not see them replace soil sampling or soil nutrient analysis soon.
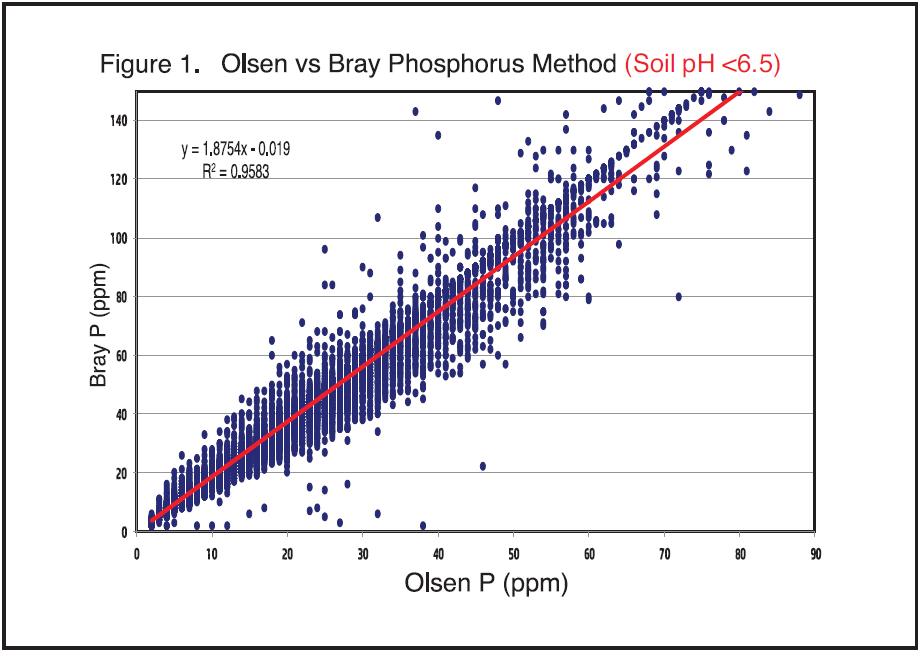
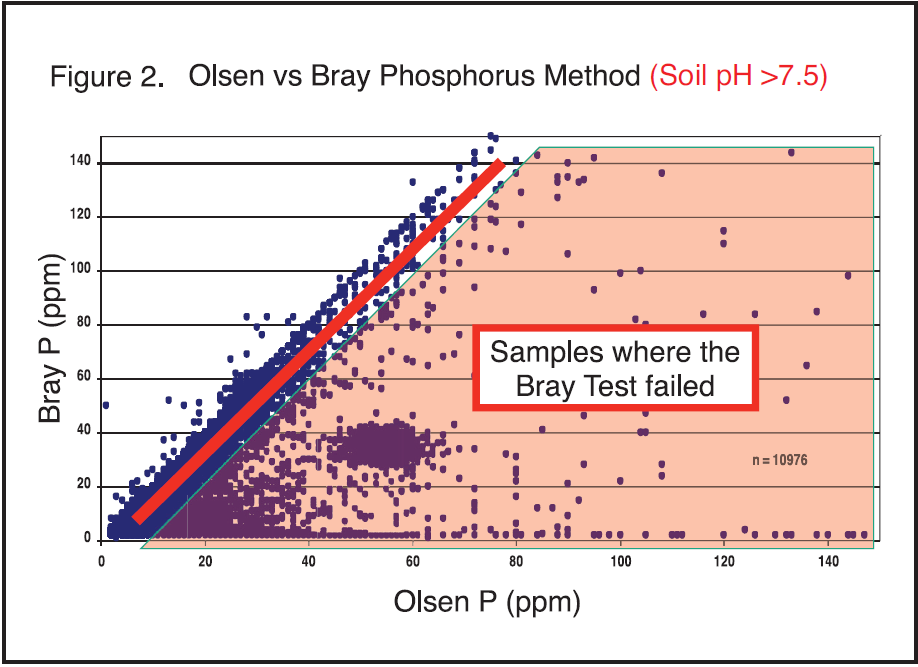
Third, the handheld sensor outputs are often correlated and converted, in the end, to traditional wet chemistry analysis methods, like Bray P, Olsen P, or ammonium acetate K. These are the plant-available soil test methods that we are all familiar with and have decades of soil test calibration research behind them, which allow us to make fertilizer guideline calculations from the soil test result. Whenever a correlation and conversion step takes place, this introduces error for any subsequent calculations, like fertilizer rates. It is important to know what is actually being measured versus what is being reported.
As new sensors hit the market, a person thinking about trying them should be asking a lot of questions. AGVISE is always evaluating new analysis technologies, which can help us do a better or faster job while providing high-quality data to our clients. The questions outlined above are those that we use when we evaluate new analysis technologies for our own operation, and we hope the same questions can help guide you through the gamut of new soil sensors too.