Soil Nitrogen Trends – Fall 2023: Some Up, Some Down

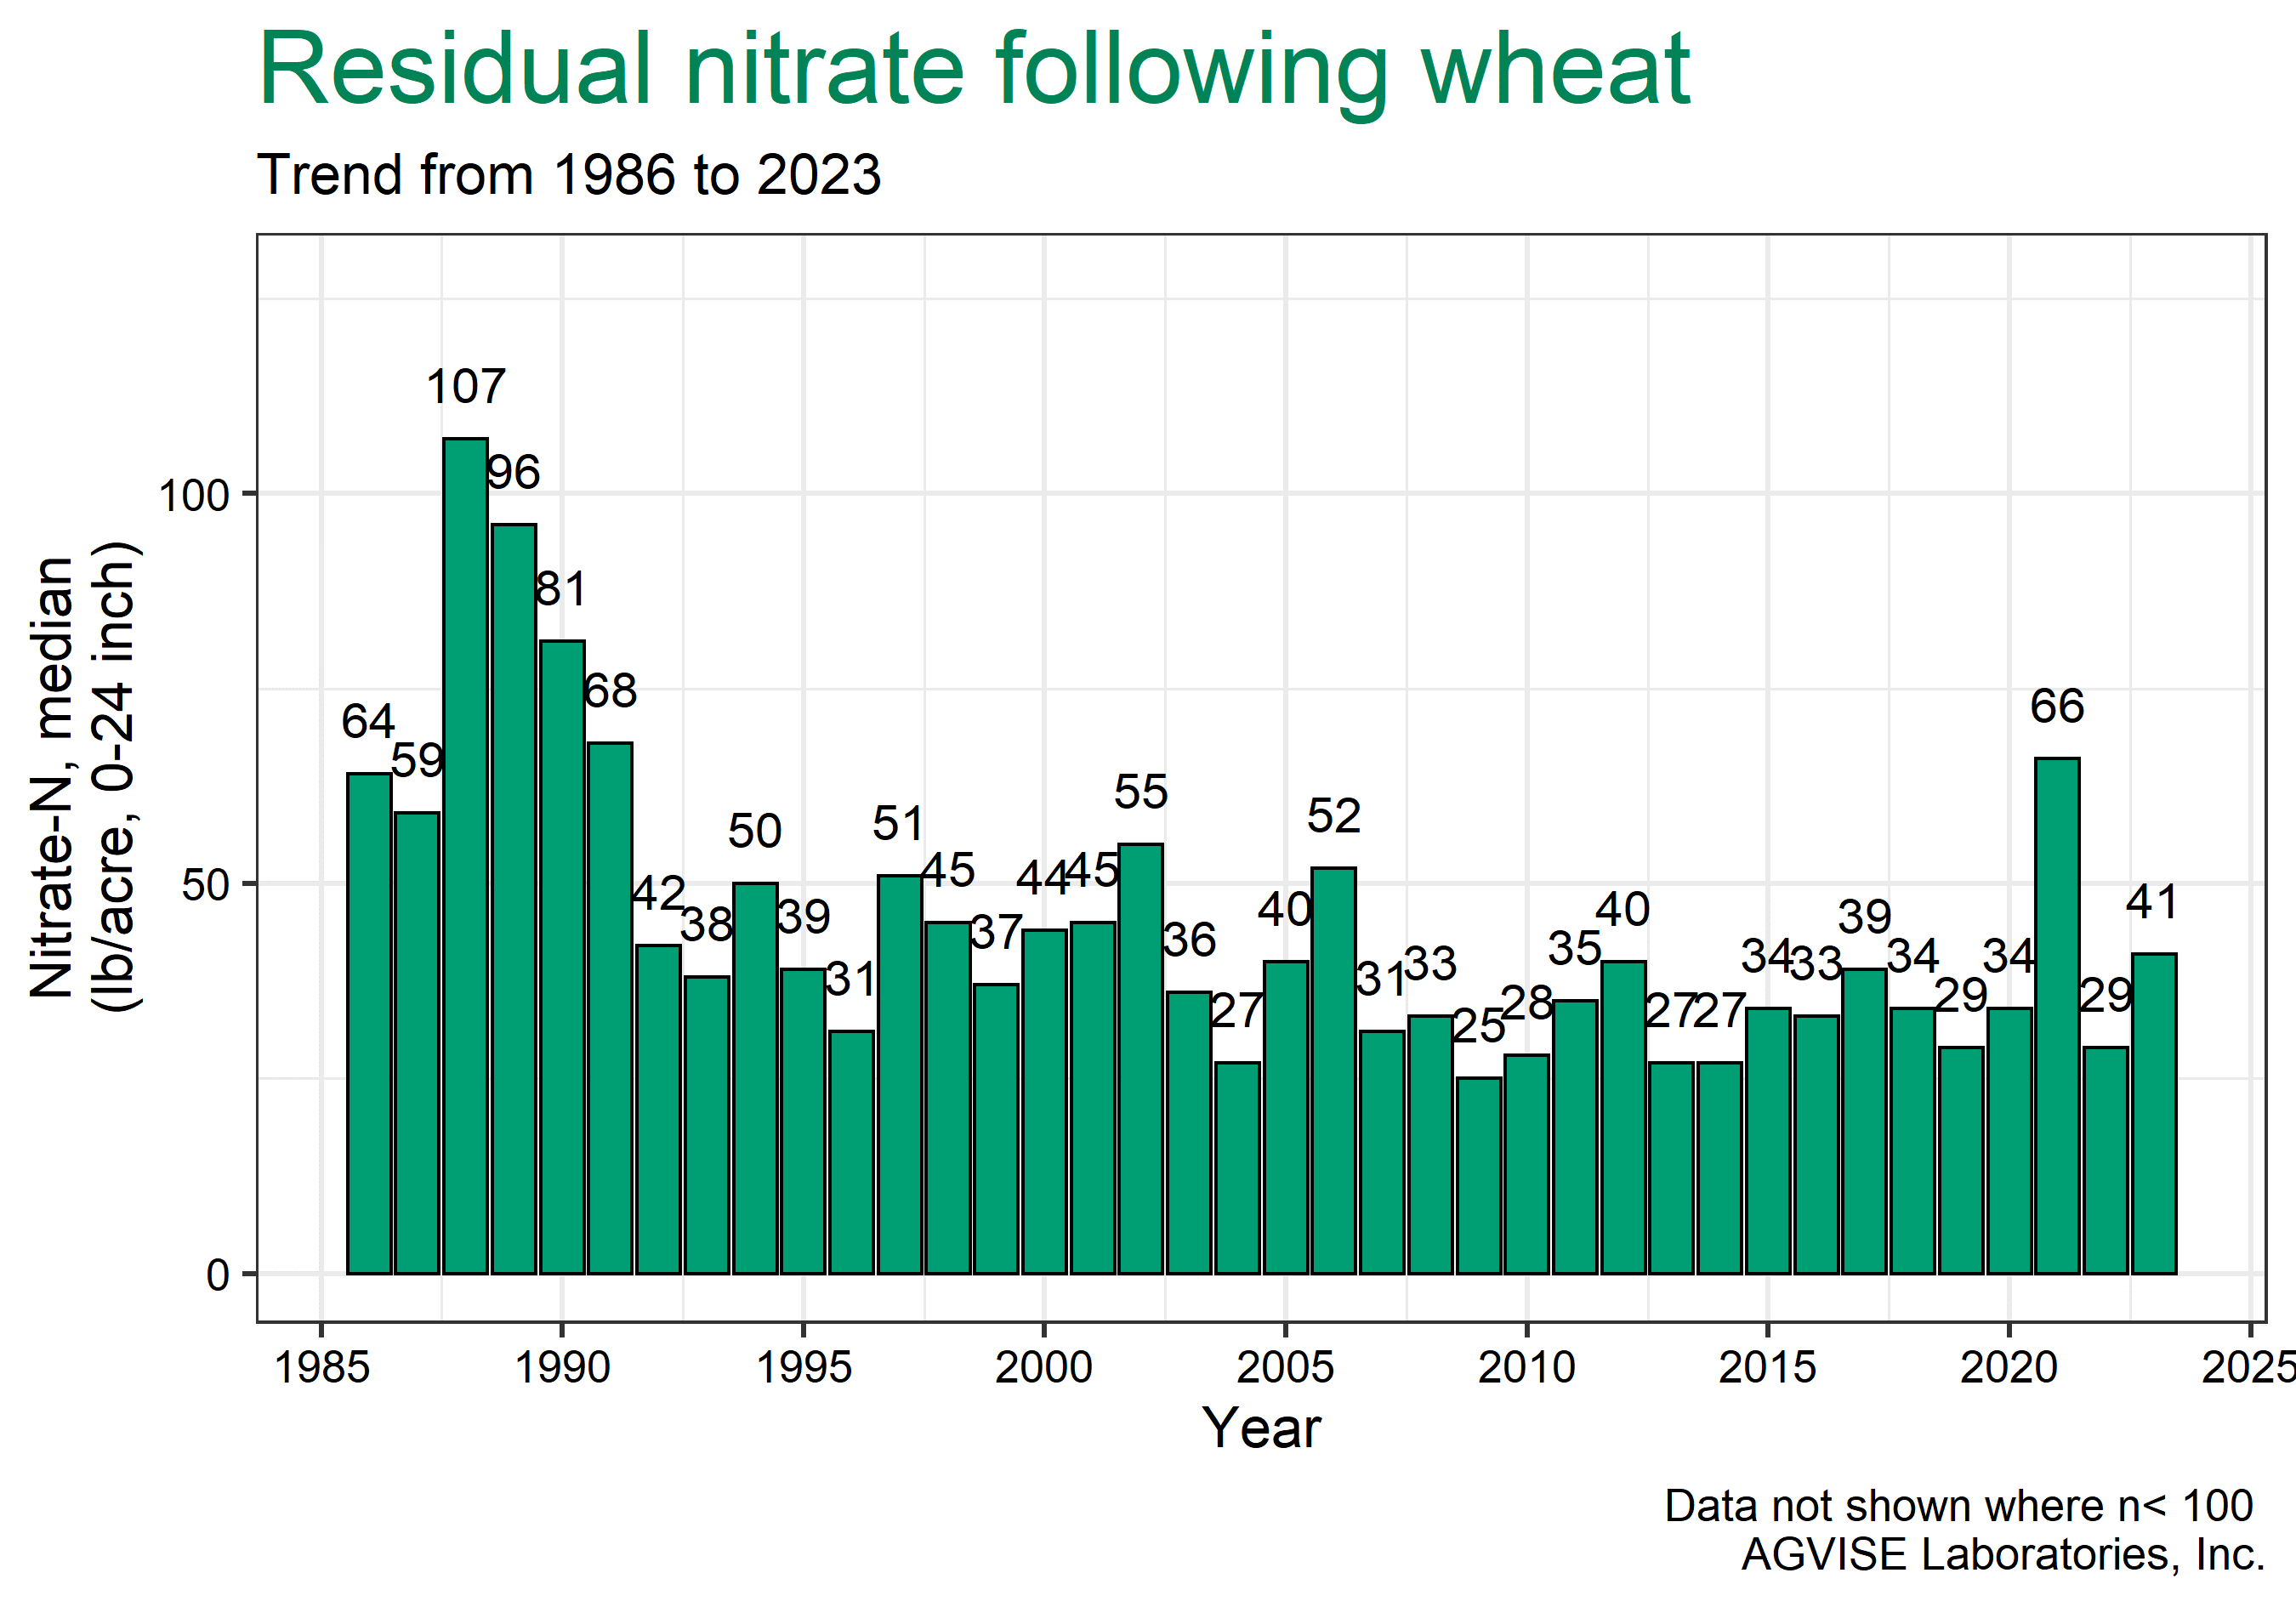
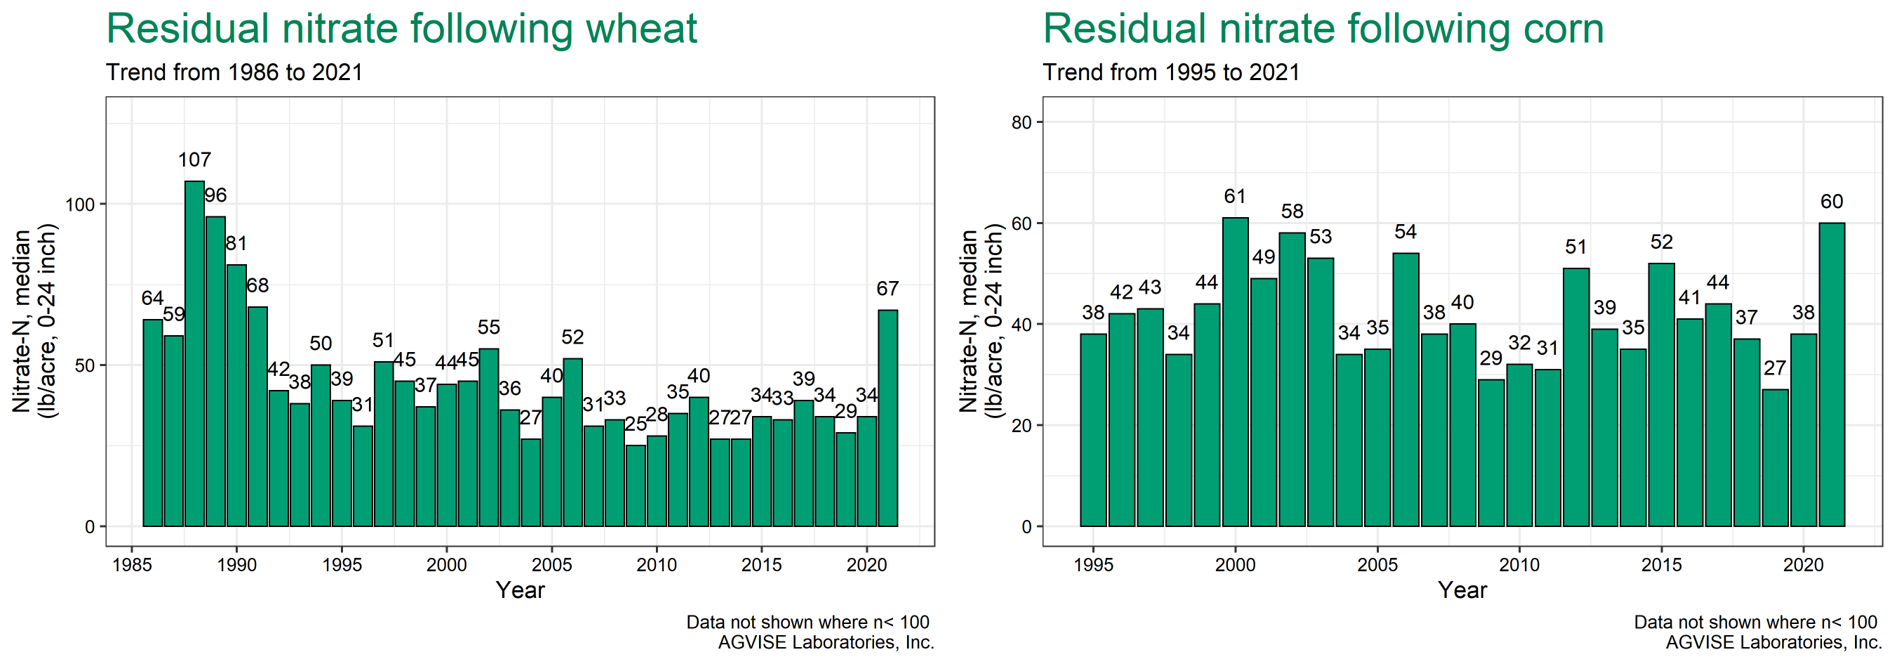
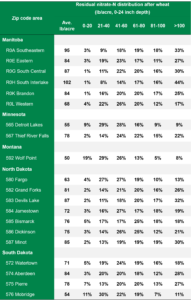
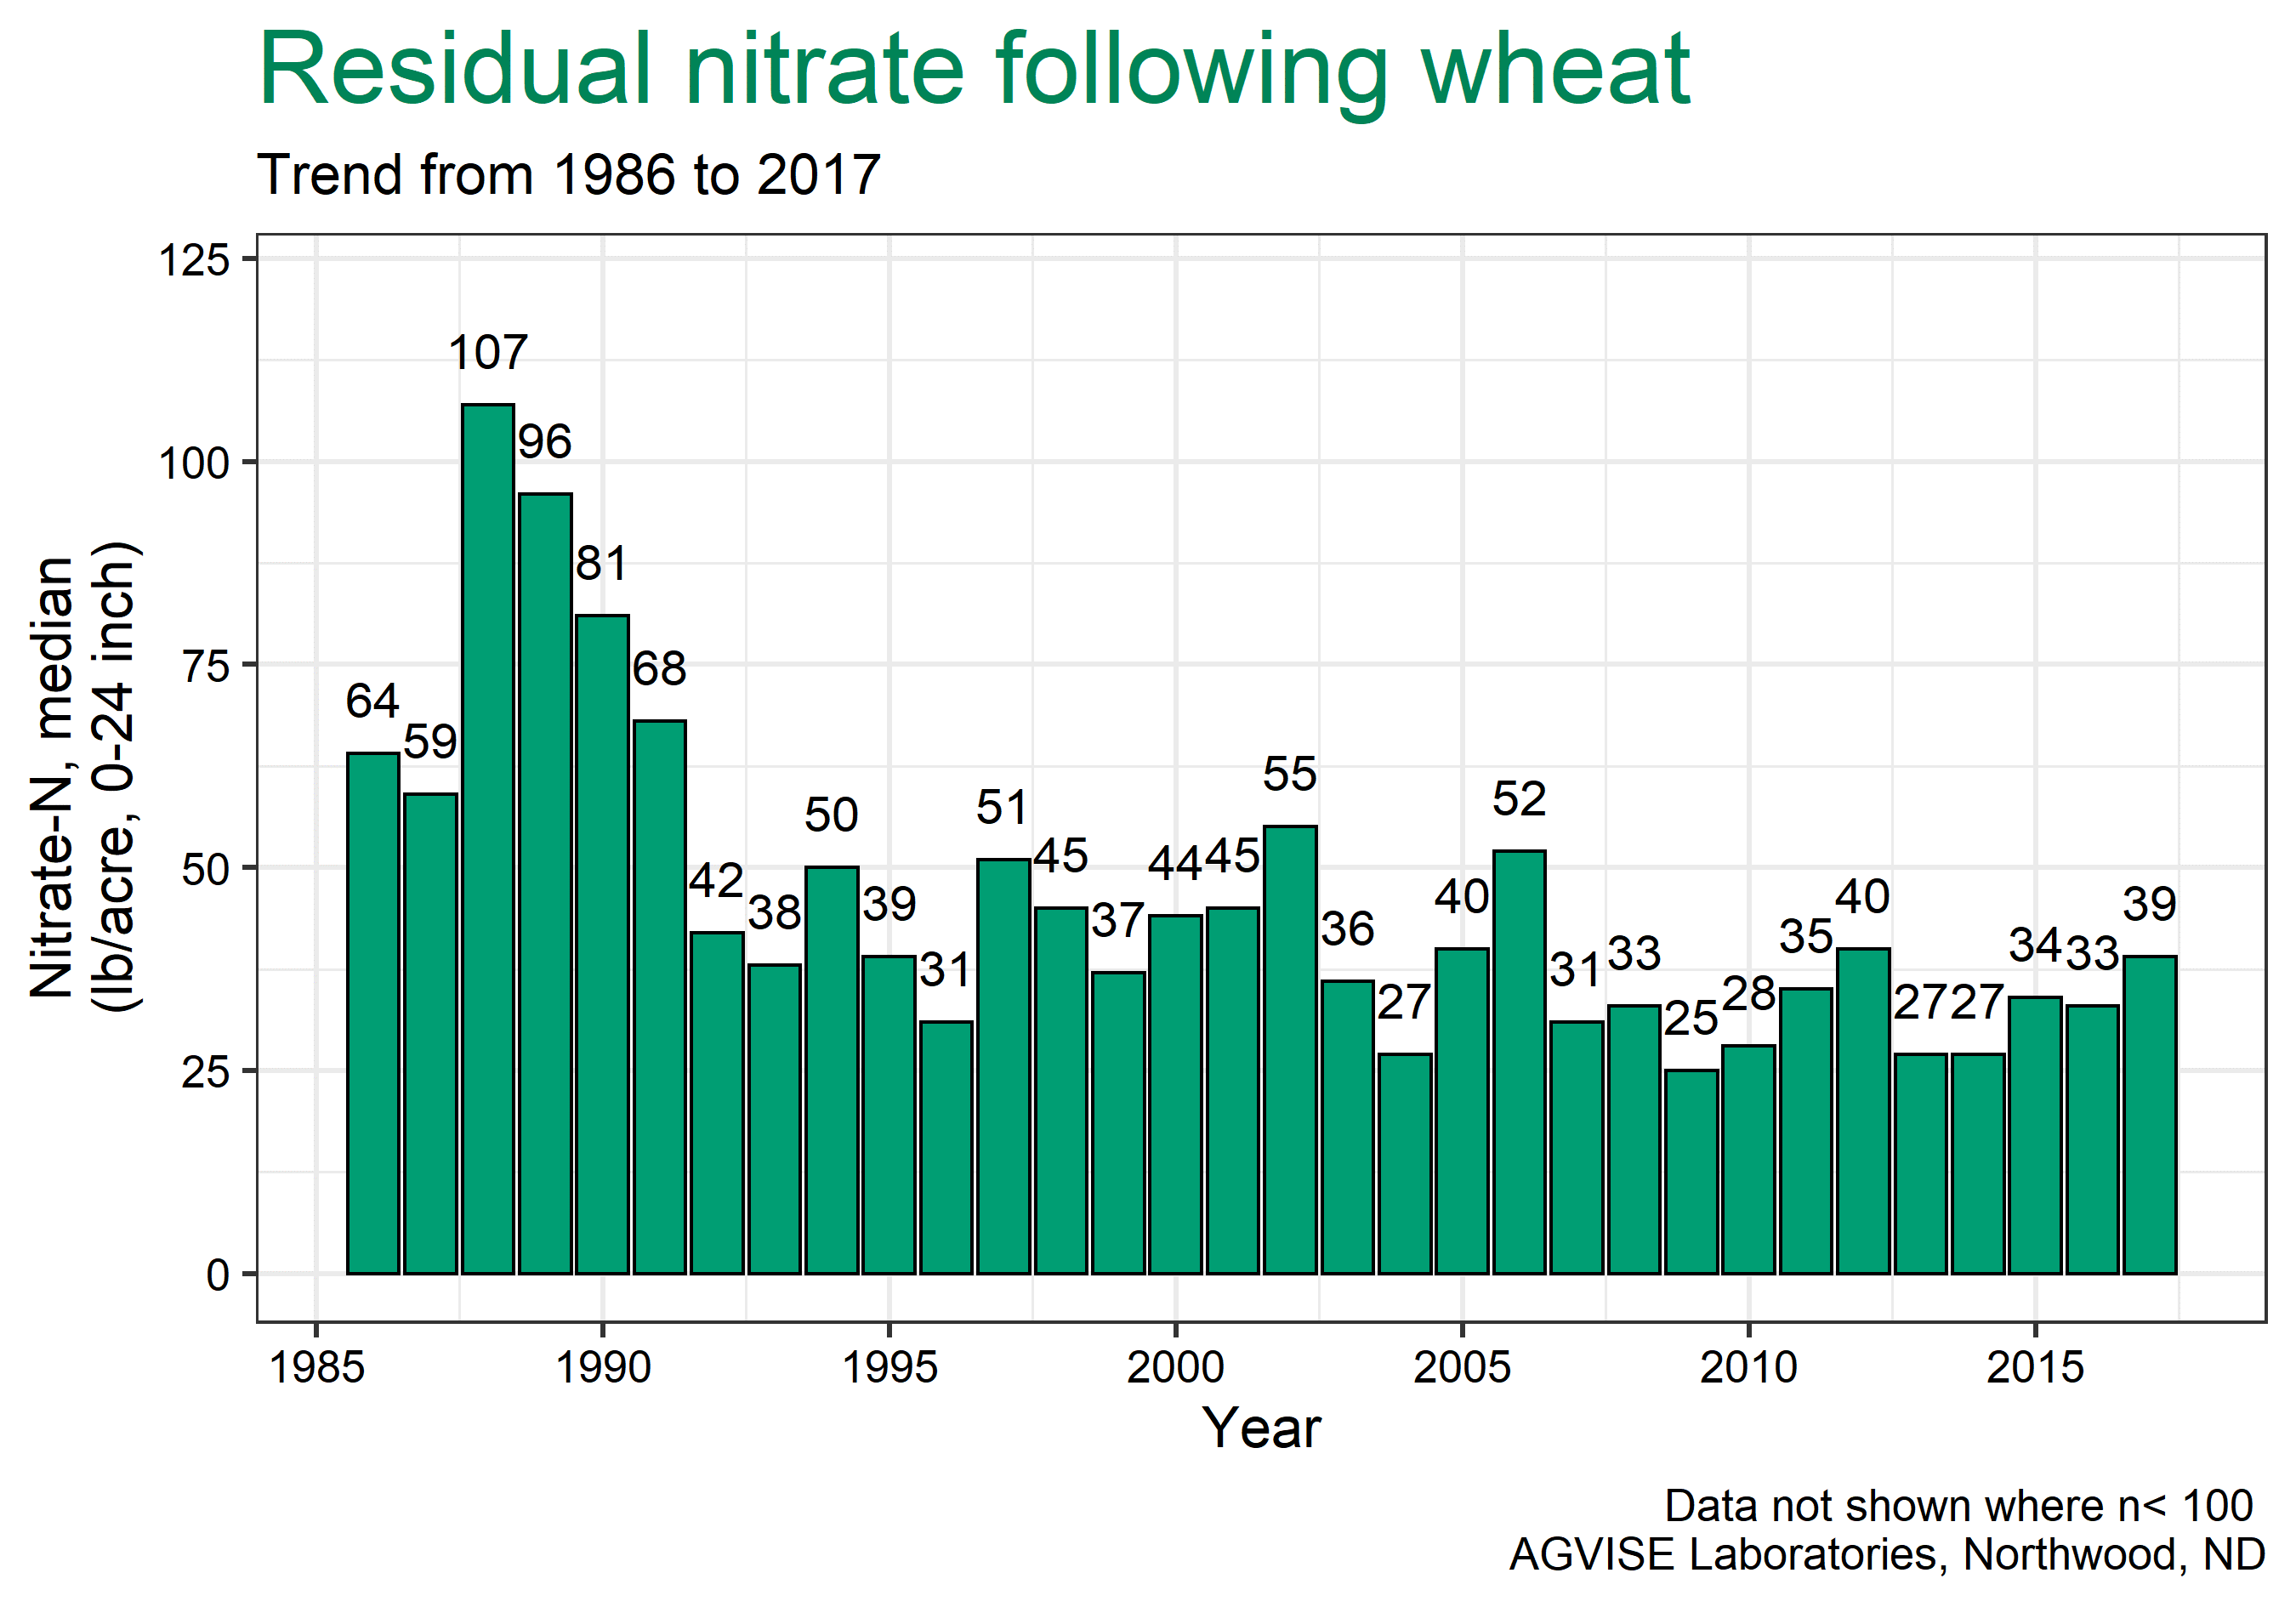
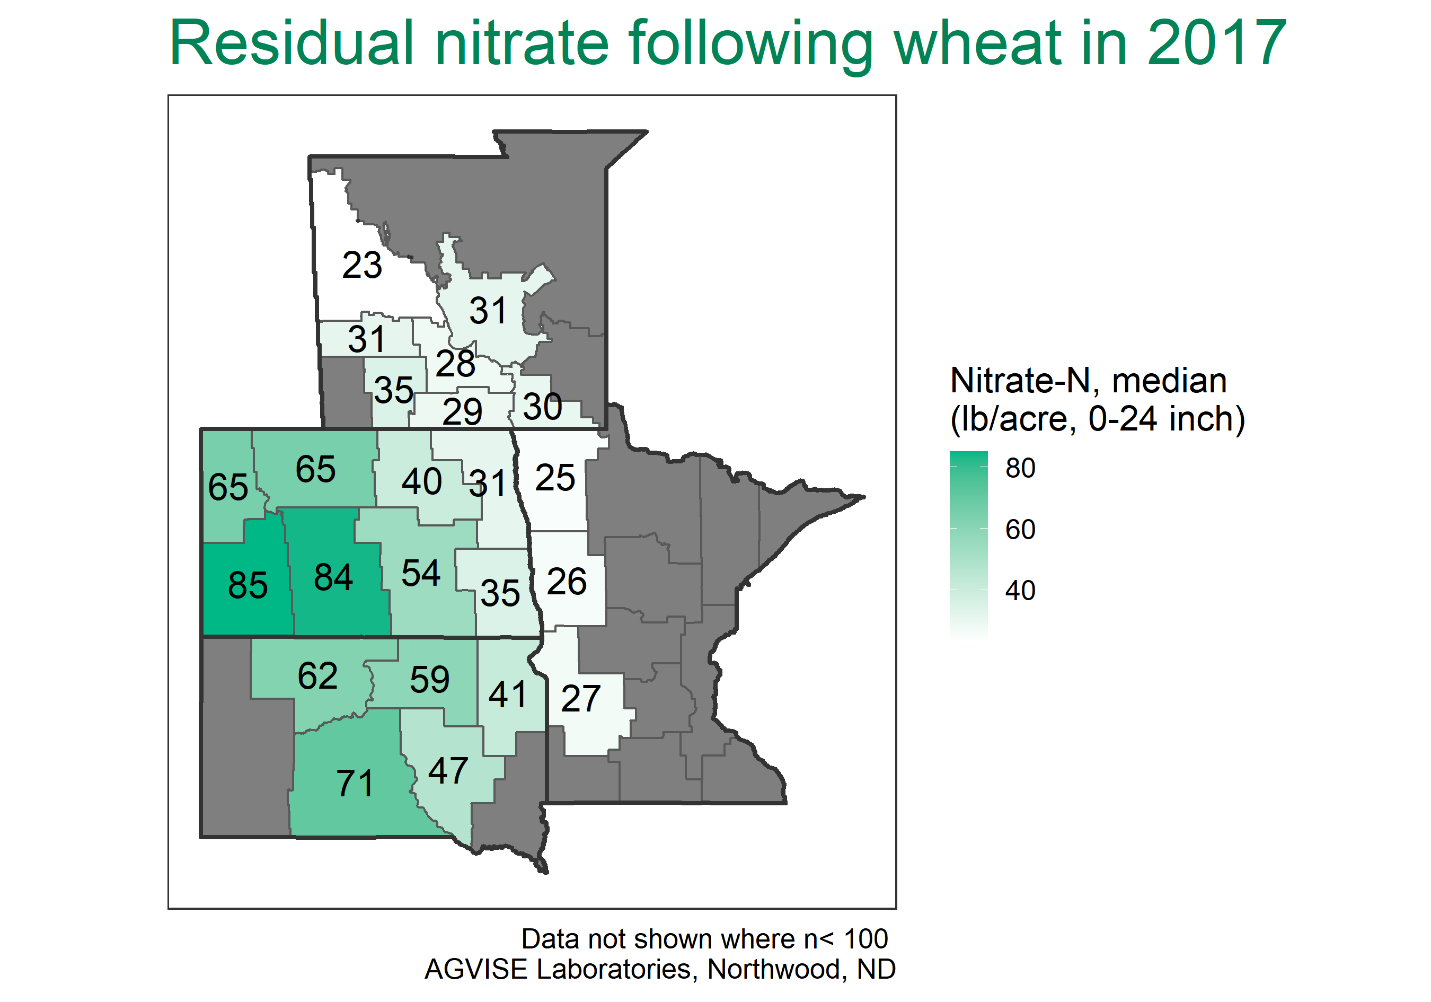
The 2023 drought was an all-too-soon reminder of the widespread 2021 drought. It covered much of the upper Midwest, Great Plains, and Canadian Prairies. From previous experience with droughts, we expected that residual soil nitrate-N following crops would be higher than normal, caused by the drought and reduced crop yields. The first wheat fields that were soil tested in August and September confirmed our expectation that residual soil nitrate-N was already trending higher than normal. Yet, some regions were spared the drought and received above-average rainfall, and achieved record-setting crop yields. For these regions, the amount of residual soil nitrate-N after high-yielding crops was near or below average. 

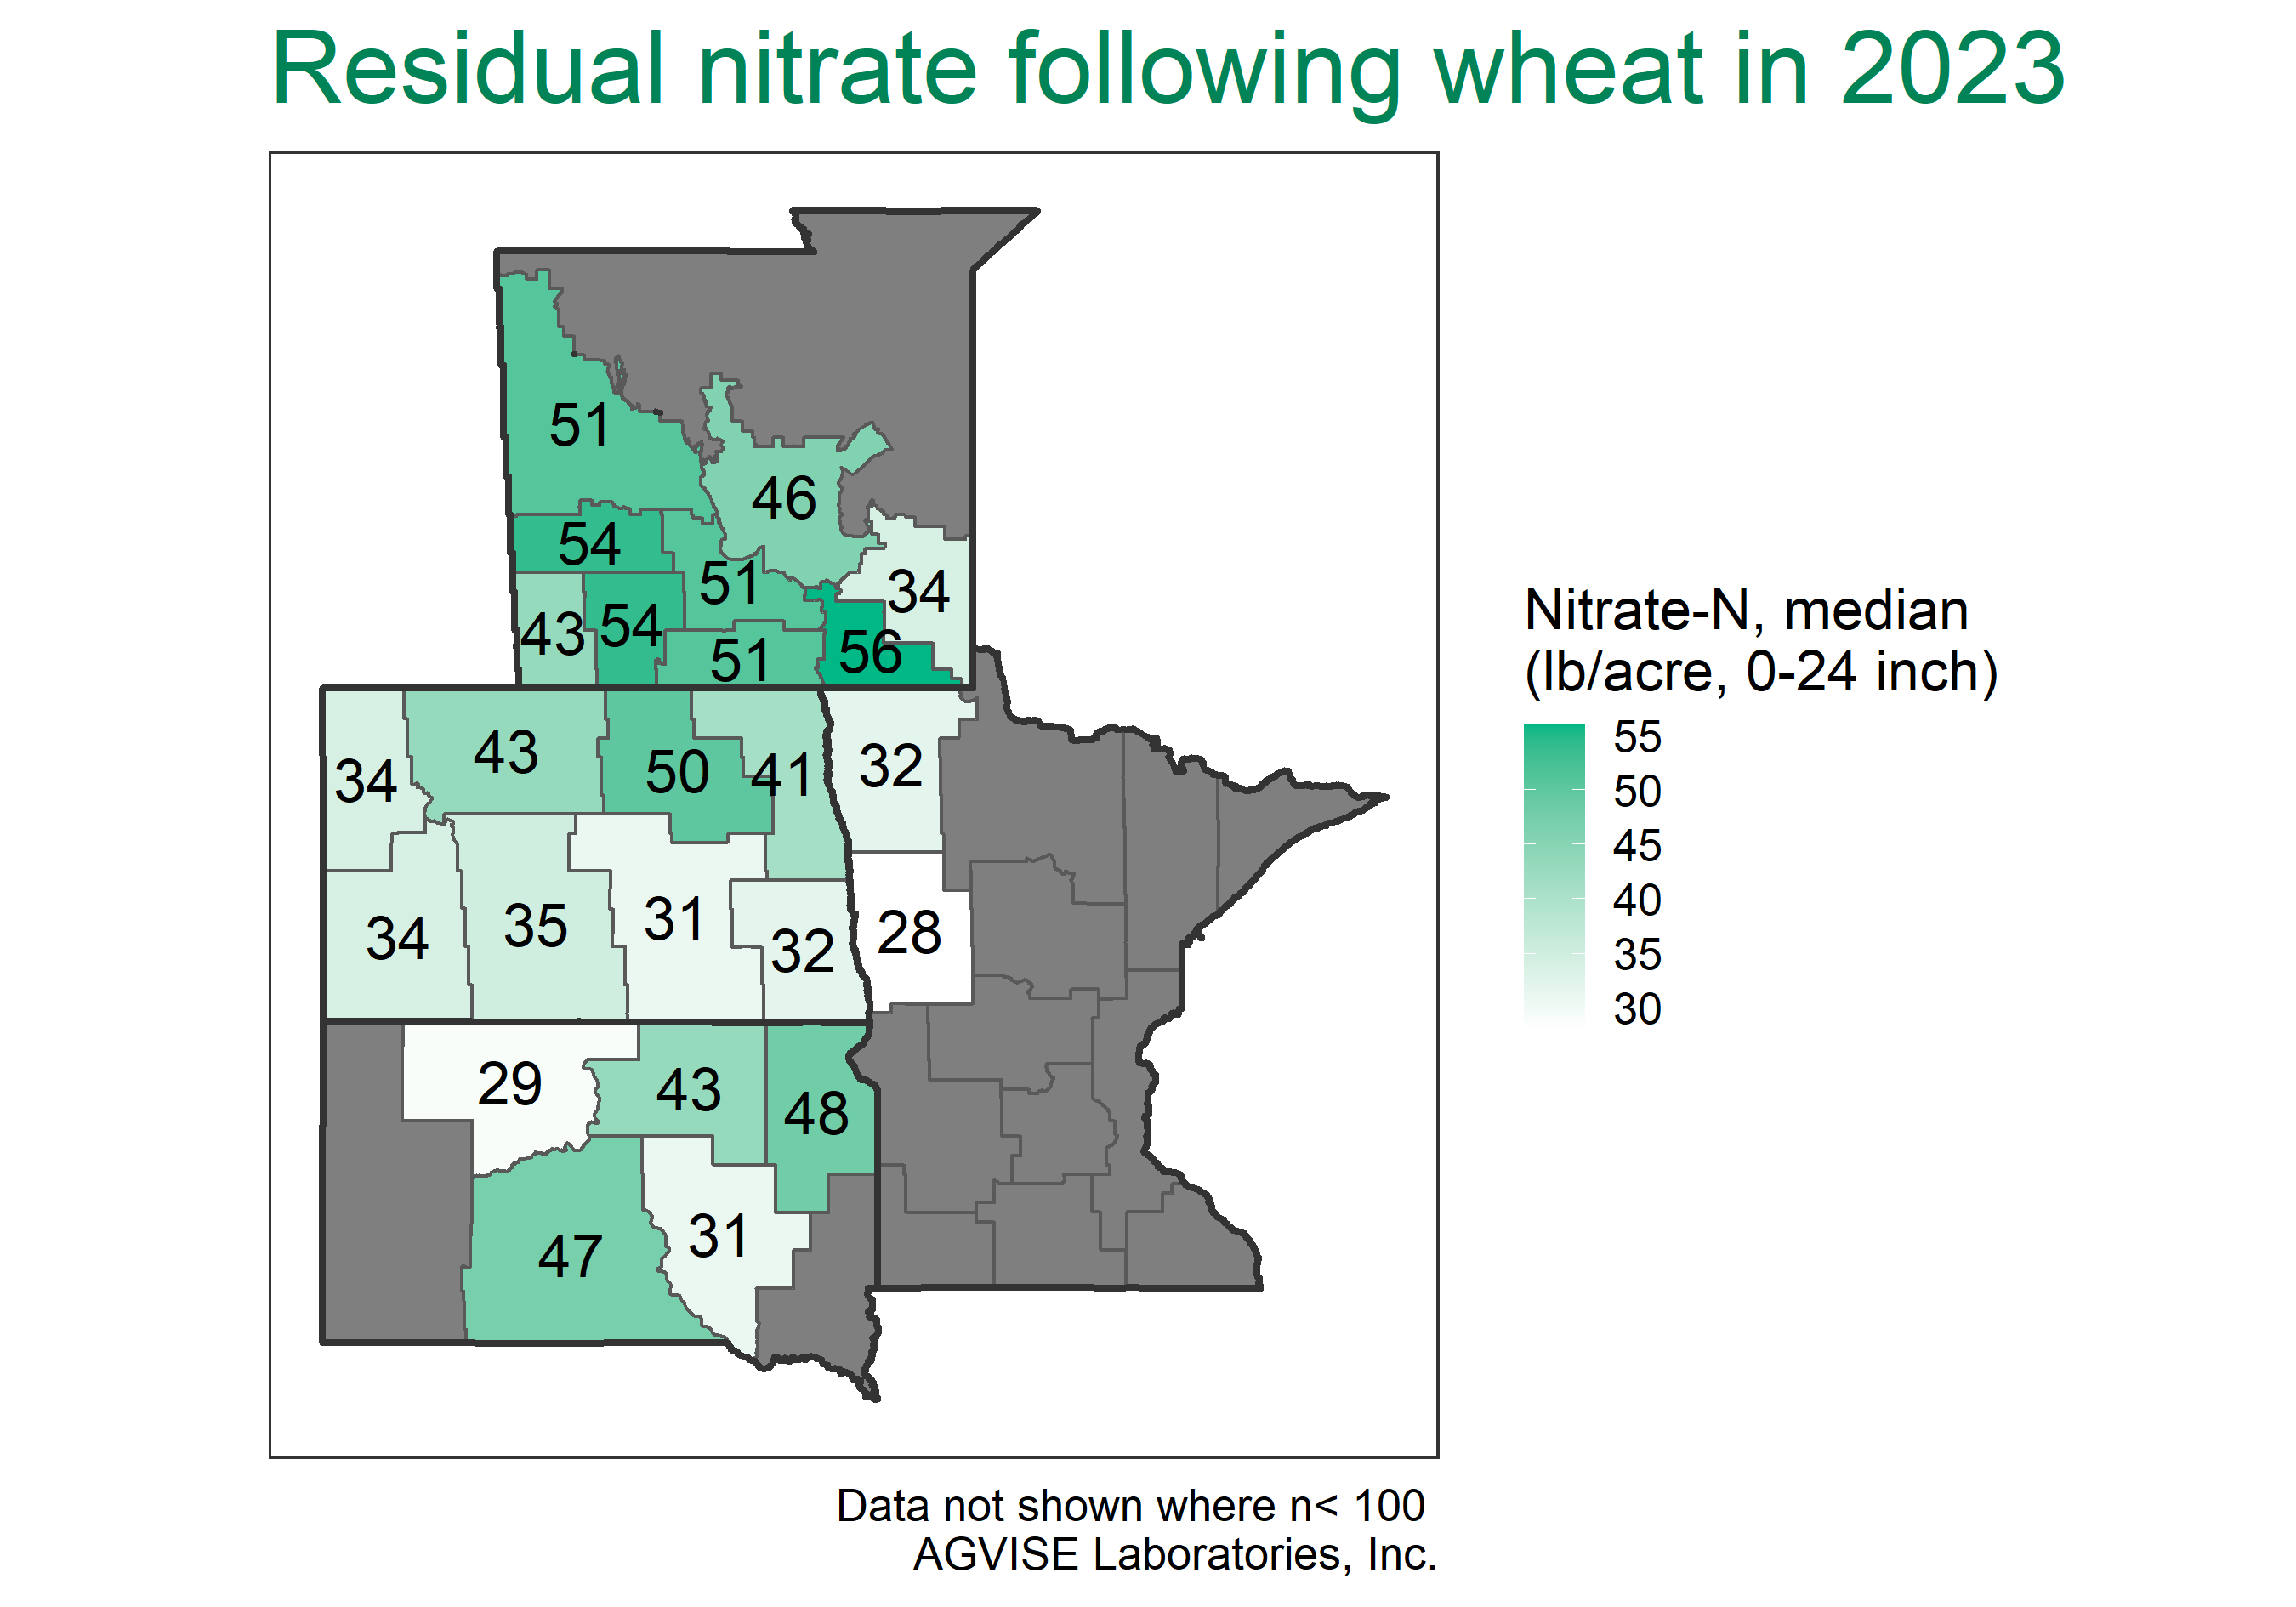
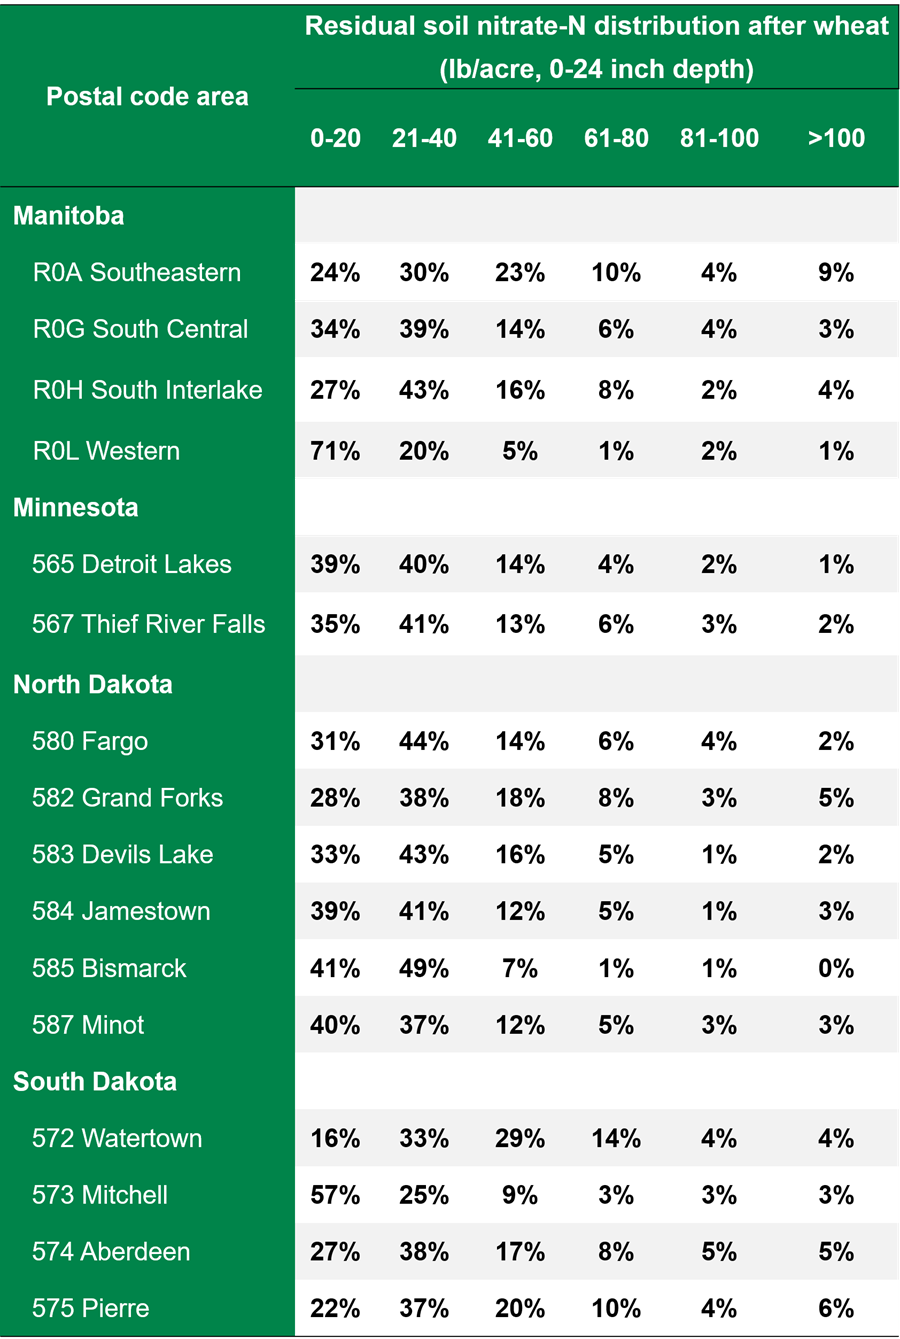
The 2023 AGVISE soil test summary data highlights the great variability following the drought. The median amount of soil nitrate-nitrogen across the region was higher than the long-term average following wheat. Over 28% of wheat fields had more than 60 lb/acre nitrate-N (0-24 inch) remaining. Yet, another 17% of wheat fields had less than 20 lb/acre nitrate-N remaining, suggesting either lost crop yield or protein due to insufficient nitrogen nutrition. For any given farm, the great variability in residual soil nitrate-N across all acres makes choosing one single nitrogen fertilizer rate impossible for next year, and soil testing is the only way to decide that right rate for each field.

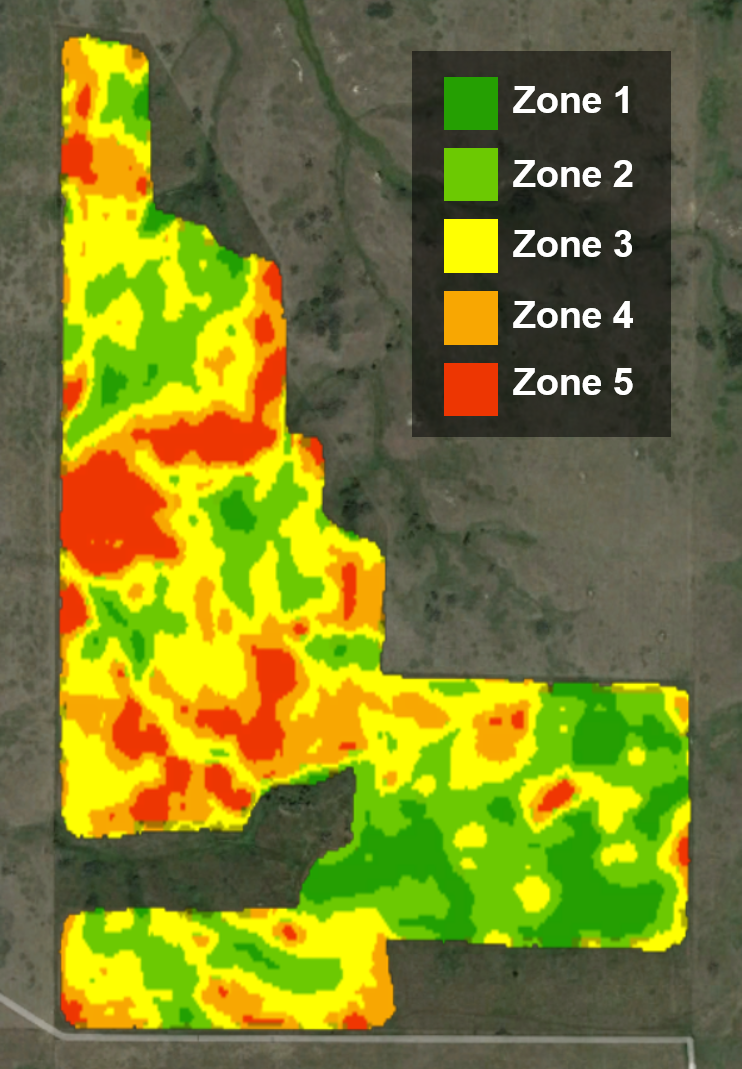
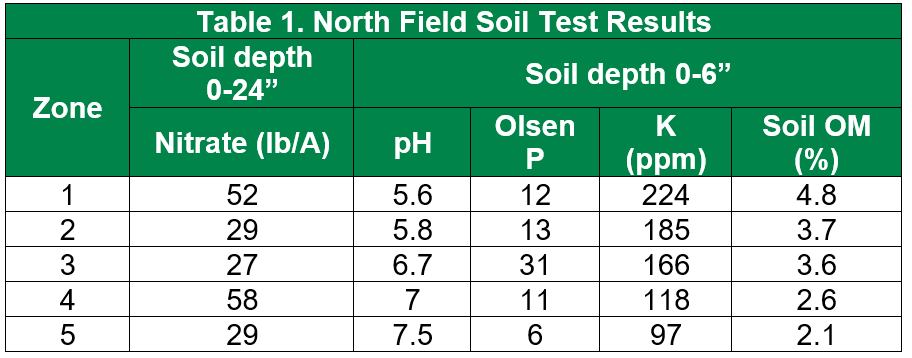
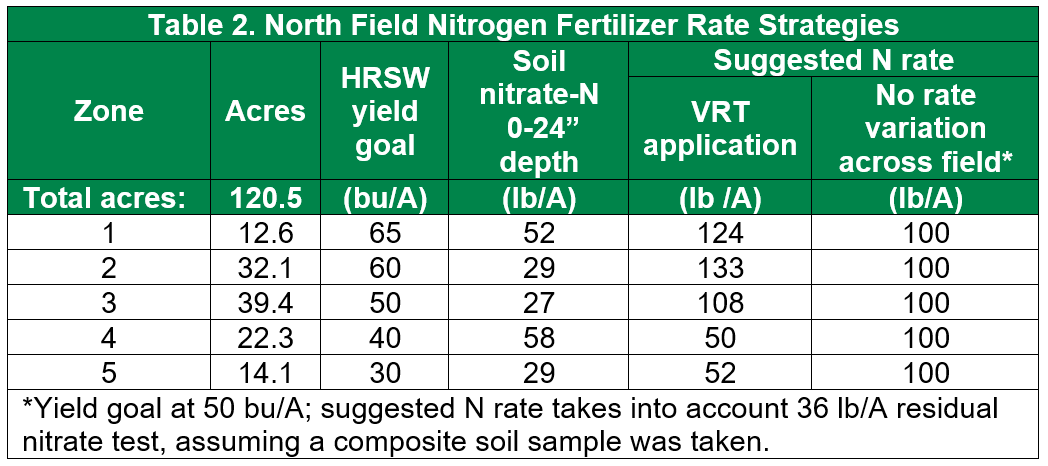
Through zone soil sampling, we are also able to identify that residual soil nitrate-nitrogen can vary considerably within the same field. This makes sense because we know that some areas of the field produced a fair or good yield, leaving behind less soil nitrate, while other areas produced very poorly and left behind much more soil nitrate. These differences across the landscape are driven by soil texture, soil organic matter, and stored soil water as well as specific problems like soil salinity or low soil pH (aluminum toxicity). Although the regional residual soil nitrate-nitrogen trends were higher overall, it is truly through zone soil sampling that we can begin to make sense of the field variability that drives crop productivity and determine the right fertilizer rate for next year.

For fields that have not been soil tested yet, there is still time to collect soil samples in winter. Nobody wants to experience another drought, but this kind of weather reminds us how important soil nitrate testing is every year for producers in the Great Plains and Canadian Prairies. Each year, AGVISE summarizes soil test data for soil nutrients and properties in our major trade regions of the United States and Canada. For more soil test summary data and other crops, please view our soil test summaries online: https://www.agvise.com/resources/soil-test-summaries/

Early Soil Nitrate Trends after Wheat in 2022

Small grain harvest is well underway across the region, and soil testing is progressing quickly. Crop yields have varied from below average to exceeding expectations across the region and often in the same area. Planting date, summer temperatures, and rainfall (too little or too much) were major factors this year.

The major factors influencing the amount of residual soil nitrate-N after crops are:

1.     Nitrogen fertilizer rate: too high or too low
2.     Crop yield achieved: much lower or higher than expected
3.     Nitrogen losses: denitrification and leaching after too much rainfall
4.     Nitrogen mineralization from organic matter: cool or warm growing season

Seasonal weather is a large driving factor in the amount of nitrate-N in the soil profile. This changes from field to field and year to year. Early spring weather conditions were very wet across much of the region. In June and July, some areas continued to receive adequate to excess rainfall. Meanwhile, other areas received very little rain in the late growing season.

AGVISE has tested over 10,000 soil samples from wheat fields across the region. The table below indicates the percentage of soil samples in each soil nitrate-nitrogen category in several areas of Manitoba, Minnesota, North Dakota, and South Dakota. The data should give you a general idea of how variable residual soil nitrate is from field to field in each region. With such variable crop yields, there is quite a bit of variability in residual nitrate following wheat in the region. In drought-affected areas of Minnesota, North Dakota, and South Dakota, over 10 to 20% of soil samples have more than 60 lb/acre nitrate-N (0-24 inch soil profile) remaining after wheat.

What about Prevented Planting or unseeded acres?

For Prevented Planting or unseeded acres, the factors above plus some additional factors will affect the amount of residual nitrate-nitrogen:

1.     How long was water standing on the field?
2.     Was weed growth controlled, early or late?
3.     Was tillage used? How many times? How deep?
4.     Was a cover crop planted? What amount of growth was achieved?

When submitting soil samples from fields that were not planted, please choose “Fallow” or “Cover Crop” as the previous crop. This will allow us to send additional information on soil nitrate trends for unseeded and cover crop fields once we get enough data.

As the fall soil testing season continues, we will keep you updated. If you have any questions, please call our experienced agronomic staff. We hope you have a safe harvest and soil testing season.


Zone Soil Sampling and Variable Rate Fertilization: Optimizing profits

This article originally appeared in the AGVISE Laboratories Winter 2022 Newsletter

Farmers, like all business owners, are profit maximizers: things are good when revenue exceeds cost. Things are even better when the difference between revenue and costs is substantial. The math behind increasing profit is simple: reduce costs, increase revenue. But, the difficult part is finding and implementing strategies on the farm to do this. Why not start with fertilizer, which is typically the largest annual input cost on the farm?

Your fields are variable. You know the hilltops have lower crop yields than the mid-slopes, and you know exactly how far the saline spots creep into the more productive part of the field. So why use the same rate of fertilizer in the unproductive areas as you would in the productive areas? Optimize your fertilizer inputs by reducing rates in low-yielding areas and reallocate those fertilizer dollars to the productive ground.

The North Field Zone Map

Figure 1. North Field zone map, created using ADMS from GK Technology.

How does one actually do this? Creating zone maps for your fields, soil sampling and testing based on productivity zones, and variable rate (VRT) fertilizer application is the place to start. Applying VRT fertilizer allows you to apply fertilizer where it is needed and not waste fertilizer dollars where it is not. Let me show you an example from my family’s farm in western North Dakota.

I farm with my dad and brother in southwest North Dakota. This past fall, I created zone maps for each of our fields, with help from GK Technology and their ADMS program. The final maps are based on historical satellite imagery. I will show you one of our fields, the North Field, and take a deep dive on nitrogen fertilizer optimization using zone soil sampling and VRT fertilization in the dryland “out west” country.

The North Field (Figure 1) is variable. That is expected on a 120-acre field with many hills and ravines (Table 1). For discussion, we will use residual soil nitrate-nitrogen results and make a nitrogen fertilizer plan using urea for hard red spring wheat (HRSW) in 2022. You can see the soil nitrogen data, crop yield goals, and final nitrogen rates in Table 2.


The first place to optimize fertilizer inputs is setting realistic crop yield goals for each zone. Spring wheat yield goals range from 65 bushel/ acre in the best zone (zone 1) to 30 bushel/acre on the hilltops (zone 5). Adjusting the nitrogen rate for the proper crop yield goal ensures that the high-producing zones are not limited by lack of nitrogen (increased fertilizer cost, increased revenue) and the low-producing zones are not overfertilized (decreased fertilizer cost, same revenue). With a responsible crop yield goal on the low-producing zones, the crop still receives the amount of nitrogen it requires, and excess nitrogen is not lost to nitrate leaching (wasted input cost). As a result, the excess nitrogen fertilizer is reallocated to high-producing zones, resulting in more crop yield with the same total fertilizer budget, and increased revenue.

The nitrogen fertilizer scenarios in Tables 3 and 4 break down the projected revenues and expenses, demonstrating the benefits of zone soil sampling and VRT fertilization. For the North Field on my farm, the projected profit increase was $3,725 for the field or $31.05 per acre. It is tough to argue with a dollar amount like that! Prices will vary, of course, for fertilizer and precision ag services in your geography. Do the math for yourself and see how zone soil sampling and VRT fertilization can maximize profits for you.

2021 Drought: High residual soil nitrate-nitrogen across the region

This article originally appeared in the AGVISE Laboratories Winter 2022 Newsletter

The 2021 drought rivals the 1988 drought, and it covered much of the northern Great Plains and Canadian Prairies. From previous experience with droughts, we expected that residual soil nitrate-N following crops would be higher than normal, caused by the drought and reduced crop yields. The first wheat fields that were soil tested in August and September confirmed our expectation that residual soil nitrate-N was already trending much higher than normal.

The 2021 AGVISE soil test summary data highlights how exceptional the 2021 drought was. The median amount of soil nitrate-N across the region was markedly higher following wheat and corn. Over 20% of wheat fields had more than 100 lb/acre nitrate-N (0-24 inch) remaining, and another 40% of wheat fields had a sizable 40 to 80 lb/acre nitrate-N (0-24 inch) left over. For any given farm, the great variability in residual soil nitrate-N makes choosing one single nitrogen fertilizer rates impossible, and soil testing is the only way to decide that right rate for each field.

Through zone soil sampling, we were also able to identify that residual soil nitrate-N varied considerably within a field. This makes sense because we know that some areas of the field produced a fair yield, leaving behind less soil nitrate, while other areas produced very poorly and left behind much more soil nitrate. These differences across the landscape are driven by soil texture, soil organic matter, and stored soil water as well as specific problems like soil salinity or low soil pH (aluminum toxicity). Although the regional residual soil nitrate-N trends were higher overall, it is truly through zone soil sampling that we can begin to make sense of the field variability that drives crop productivity and the right fertilizer rate for next year.

For fields that have not been soil tested yet, there is still time to collect soil samples in winter (see winter soil sampling article). Nobody wants to experience another drought, but this kind of weather reminds us how important soil nitrate testing is every year for producers in the Great Plains. Each year, AGVISE summarizes soil test data for soil nutrients and properties in our major trade region of the United States and Canada. For more soil test summary data and other crops, please take a look at our soil test summaries online.


Updated Residual Soil Nitrate Trends (Variability is high this year)

The 2022 growing season may seem like a long way off, but spring will be here before we know it. In fact, many growers are already making (or have made) crop choices and seed variety decisions for 2022. One factor that must be considered when making crop and variety selections for 2022 is residual soil nitrate-nitrogen following the 2021 growing season. For many in the northern Great Plains and Canadian Prairies, the 2021 growing season was hot and dry, which resulted in high residual soil nitrate levels following many crops. An update on average residual nitrate levels after wheat, broken down by geography, is below (Table 1). Residual soil nitrate-nitrogen following other crops, including soybean, are also higher than average (Table 2). This highlights the importance of soil sampling, even after crops we do not typically think of leaving high residual soil nitrate behind.

The data in the tables represents a snapshot of the samples we have tested so far this fall. While the average residual soil nitrate-nitrogen for an area may be interesting to talk about, it is not a replacement for actual soil test results from you or your growers’ fields. The data shows that over 30% of the wheat fields in many areas (see the right-hand column of the table) test over 100 lb/acre soil nitrate (0-24 inch depth). Droughts like 1988 and 2021 are very uncommon and leave us in situations that we are not used to dealing with. Using an average soil nitrate level from a region to decide an N rate on an individual field would be like deciding to apply an insecticide on every acre of the farm without even looking at each field to see if the insect is present. You need actual soil test data on each field to make informed decisions.

Table 1. Residual nitrate trends as of Sept. 17, 2021 from more than 20,000 soil samples taken after wheat. Regions with less than 100 soil samples are not included in the table.

Table 2. Residual nitrate trends as of Sept. 17, 2021 for crops other than wheat. Regions with less than 100 soil samples for each respective crop are not included in the table.

High Fertilizer Prices

According to the September 15, 2021 DTN fertilizer price survey, retail fertilizer prices continue to rise. The average price per pound of nitrogen by fertilizer product is $0.61/lb N for urea, $0.46 lb/N for anhydrous ammonia, and $0.66/lb N for UAN-28. This represents a 55%, 73%, and 71% increase in price compared to prices for the same fertilizers this time last year. Long story short, fertilizer is expensive. High residual soil nitrate following wheat may help reduce input costs in 2022, as long as you know what the residual soil nitrate in your fields is and take advantage of it by growing a crop that requires nitrogen fertilizer. If you have a soil nitrate test of 80 lb/acre (0-24 inch) after wheat, that is about 50 lb more than normal carry over. The extra 50 lb/acre soil nitrate is worth $30.00/acre (based on the current urea price).

Starter Fertilizer: Choosing the Right Rate

Starter fertilizer placed with or near the seed is essential for vigorous early season growth in grass crops such as corn and wheat. We plant these crops early because we know vigorous early season growth is important to achieving high crop yields. Early planting also means cold soils, and starter fertilizer is necessary to get the crop going with a good start. Each spring, we receive many questions about starter fertilizer placement and seed-safe fertilizer rates. These questions come from farmers who want to plant as many acres per day as possible, take advantage of more efficient banded phosphorus placement, and of course reduce fertilizer costs.

The two most common questions we get are “What is highest rate of starter fertilizer I can apply with the seed?” and “What is the lowest rate of starter fertilizer I can apply with the seed and still get a starter effect?” South Dakota State University (SDSU) made a downloadable spreadsheet that calculates the maximum seed-safe fertilizer rate (Figure 1). The spreadsheet will ask for the crop choice, fertilizer product, seed opener width, row spacing, tolerable stand loss, soil texture, and soil water content. The spreadsheet calculations are based on SDSU greenhouse and field studies.

Seed Safety Calculator from SDSU for Starter Fertilizer Article

Figure 1. Fertilizer Seed Decision Aid from South Dakota State University. Download the spreadsheet here

Research has shown, that to achieve the full starter effect, a fertilizer granule or droplet must be within 1.5 to 2.0 inches of each seed. If the fertilizer granule or droplet is more than 1.5 to 2.0 inches away from the seed, the starter effect is lost. To illustrate the role of starter fertilizer rates and seed placement, AGVISE put together displays showing the distance between fertilizer granules or droplets at various rates and row spacings. For example, take a look at wheat planted in 7-inch rows with 30 lb/acre P2O5 (57 lb/acre 11-52-0) and corn planted in 30-inch rows with 30 lb/acre P2O5 (7.5 gal/acre 10-34-0). You need to maintain a sufficient starter fertilizer rate to keep fertilizer granules or droplets with 1.5 to 2.0 inches of each seed.

Starter fertilizer demonstration example for starter fertilizer article

Figure 2. Two examples from the AGVISE Starter Fertilizer Display series. Find more crops and fertilizer rates here.

In the northern Great Plains and Canadian Prairies, most fertilizer is applied at planting and often as seed-placed fertilizer. This creates a challenge to prevent soil nutrient mining when balancing seed safety and crop nutrient removal with higher crop yield potential. Soil nutrient mining occurs when you apply less fertilizer than crop nutrient removal, resulting in soil test P and K decline over time. Some broadleaf crops, like canola and soybean, are very sensitive to seed-placed fertilizer, allowing only low seed-placed fertilizer rates. In contrast, most cereal crops can tolerate higher seed-placed fertilizer rates. To maintain soil nutrient levels across the crop rotation, you need to apply more phosphorus fertilizer in crops that allow greater seed safety. You can apply more phosphorus fertilizer with crops like corn or wheat, which allows you build soil test P in those years, while you mine soil test P in canola or soybean years. If you cannot the maintain crop nutrient removal balance with seed-placed fertilizer, then you need to consider applying additional phosphorus in mid-row bands or broadcast phosphorus at some point in the crop rotation.

Table 1. Seed-safe fertilizer rates may not meet crop removal. In the example, the seed-safe limit is based on 1-inch disk or knife opener and 7.5-inch row spacing for air-seeded crops and 30-inch row spacing for corn. Phosphorus (P) balance: Seed-safe limit (lb/acre P2O5) minus crop P removal (lb/acre P2O5). A negative P balance indicates the seed-safe limit does not meet crop removal, which may decrease soil test P.

Starter fertilizer is an important part of any crop nutrition plan. Here are more resources to help you make the best decisions on starter fertilizer materials, placement, and rates.

Fertilizer Application with Small Grain Seed at Planting, NDSU

Safe Rates of Fertilizer Applied with the Seed, Saskatchewan Agriculture

Using banded fertilizer for corn production, University of Minnesota

Corn response to phosphorus starter fertilizer in North Dakota, NDSU

Wheat, barley and canola response to phosphate fertilizer, Alberta Agriculture

Starter Fertilizer Display: How low can YOU go?

When profits are squeezed, more farmers are asking about optimal starter fertilizer rates and how low starter fertilizer rates can be. These questions are the result of wanting to keep fertilizer costs down, to plant as many acres per day as possible, and to take advantage of more efficient, lower rates of banded phosphorus fertilizer compared to higher rates of broadcast phosphorus fertilizer.

To illustrate the role of starter fertilizer rates and seed placement, we put together displays showing the distance between fertilizer granules or droplets at various rates and row spacings. You can see several pictures with canola, corn, soybean, sugar beet, and wheat. We greatly thank John Heard with Manitoba Agriculture for helping with the displays.

The displays show the normal seed spacing for several crops with different dry or liquid fertilizer rates alongside the seed. These displays help visualize the distance between the seed and fertilizer at several rates. University research shows that to achieve the full starter effect, a fertilizer granule or droplet must be within 1.5-2.0 inches of each seed. If the fertilizer granule or droplet is more than 1.5-2.0 inches away from the seed, the starter effect is lost. Some people wonder about these displays, but you can prove it to yourself pretty easily. Just run the planter partially down on a hard surface at normal planting speed. You will see what you imagine as a constant stream of liquid fertilizer, ends up being individual droplets at normal speed, especially with narrow row spacings and lower fertilizer rates.

These displays help illustrate the minimum starter fertilizer rate to maintain fertilizer placement within 1.5-2.0 inches of each seed for the full starter effect. In addition to an adequate starter fertilizer rate, additional phosphorus and potassium should be applied to prevent nutrient mining, causing soil test levels to decline in years when minimum fertilizer rates are applied.

Split the Risk with In-season Nitrogen

For some farmers, applying fertilizer in the fall is a standard practice. You can often take advantage of lower fertilizer prices, reduce the spring workload, and guarantee that fertilizer is applied before planting. As you work on developing your crop nutrition plan, you may want to consider saving a portion of the nitrogen budget for in-season nitrogen topdress or sidedress application.

Some farmers always include topdressing or sidedressing nitrogen as part of their crop nutrition plan. These farmers have witnessed too many years with high in-season nitrogen losses, usually on sandy or clayey soils, through nitrate leaching or denitrification. Split-applied nitrogen is one way to reduce early season nitrogen loss, but do not delay too long before rapid crop nitrogen uptake begins.

Short-season crops, like small grains or canola, develop quickly. Your window for topdress nitrogen is short, so earlier is better than later. To maximize yield in small grains, apply all topdress nitrogen before jointing (5-leaf stage). Any nitrogen applied after jointing will mostly go to grain protein. In canola, apply nitrogen during the rosette stage, before the 6-leaf stage. For topdressing, the most effective nitrogen sources are broadcast NBPT-treated urea (46-0-0) or urea-ammonium nitrate (UAN, 28-0-0) applied through streamer bar (limits leaf burn). Like any surface-applied urea or UAN, ammonia volatilization is a concern. An effective urease inhibitor (e.g. Agrotain, generic NBPT) offers about 7 to 10 days of protection before rain can hopefully incorporate the urea or UAN into soil.

Long-season crops, like corn or sunflower, offer more time. Rapid nitrogen uptake in corn does not begin until after V6 growth stage. The Pre-sidedress Soil Nitrate Test (PSNT), taken when corn is 6 to 12 inches tall, can help you decide the appropriate sidedress nitrogen rate. Topdress NBPT-treated urea is a quick and easy option when corn is small (before V6 growth stage). After corn reaches V10 growth stage, you should limit the topdress urea rate to less than 60 lb/acre (28 lb/acre nitrogen) to prevent whorl burn.

Sidedress nitrogen provides great flexibility in nitrogen sources and rates in row crops like corn, sugarbeet, or sunflower. Sidedress anhydrous ammonia can be safely injected between 30-inch rows. Anhydrous ammonia is not recommended in wet clay soils because the injection trenches do not seal well. Surface-dribbled or coulter-injected UAN can be applied on any soil texture. Surface-dribbled UAN is vulnerable to ammonia volatilization until you receive sufficient rain, so injecting UAN below the soil surface helps reduce ammonia loss. Injecting anhydrous ammonia or UAN below the soil surface also reduces contact with crop residue and potential nitrogen immobilization.

An effective in-season nitrogen program starts with planning. In years with substantial nitrogen loss, a planned in-season nitrogen application is usually more successful than a rescue application. If you are considering split-applied nitrogen for the first time, consider your options for nitrogen sources, application timing and workload, and application equipment. Split-applied nitrogen is another tool to reduce nitrogen loss risk and maximize yield potential.

Copper for Small Grains

Among crops grown in the northern Great Plains, small grains (cereals) are the most susceptible to copper deficiency. Copper (Cu) is an essential micronutrient required in small concentrations for plant growth and reproduction. Copper deficiency symptoms in cereals include pale yellowing, wilted and twisted leaf tips, and malformed seed heads. Severe copper deficiency will stop plant growth and kill plants during tiller formation. During pollination, copper deficiency will cause florets to remain partially open. This creates a vulnerable period for diseases, such as Fusarium head blight (head scab) and ergot, to infect the seed head and reduce grain yield.

Small grains sensitive to copper deficiency include barley, oat, rye, triticale, and wheat (including durum, spring, and winter types). Copper deficiency is most common on soils with less than 0.5 ppm Cu. Soils with low soil test Cu frequently include sandy soils with low organic matter (<3.0%) and organic soils (peat) with very high organic matter (>10%). Between soil and plant analysis, diagnosing copper deficiency with soil analysis is the most predictive. Plant analysis is less helpful because the plant Cu concentrations in sufficient and deficient plants are very close.

The most effective strategy to build soil test Cu on mineral soils is to broadcast-incorporate copper sulfate (25% Cu). building soil test Cu for many years. Do not mix copper sulfate with seed-placed dry fertilizer blends for air drills; copper sulfate is a hygroscopic (water holding) material that makes blending difficult and bridging is a concern. For seed-placed copper, use a liquid copper source injected in furrow. Liquid copper sources include dissolved copper sulfate and various chelated Cu products.

On organic soils, soil test Cu is difficult to build as copper readily forms complexes with soil organic matter. To reduce copper complexation, apply seed-placed liquid copper at planting and follow with foliar copper in the first herbicide application. Liquid copper sources include dissolved copper sulfate and various chelated Cu products.

High Soil Nitrogen following Drought: How to manage next year

From time to time, moderate to severe droughts hit the Great Plains. Such is life in semi-arid climates. When a drought occurs, it is normal to find higher residual soil nitrate-nitrogen after harvest. Since the widespread adoption of soil testing in the 1970s, we have seen this phenomenon in all major drought years: 1988, 2002, 2006, 2012, 2017 (Figure 1). The lack of precipitation and exhausted stored soil water reduces crop growth and yield, meaning much of the applied nitrogen fertilizer remains unused, showing up in the residual soil nitrate-nitrogen test. In 2017, very high residual soil nitrate-nitrogen was observed across wide geographies of western North Dakota and South Dakota (Figure 2).

Figure 1. Residual soil nitrate-nitrogen following wheat on the northern Great Plains.


Figure 2. Residual soil nitrate-nitrogen following wheat on the northern Great Plains in 2017.


Following a drought, we often get the question, “Can I count on all the soil nitrate in my soil test for next year’s crop?” The simple answer is yes; you can count on the amount of soil nitrate-nitrogen in the soil test, but you must consider additional factors. Even in drought, some parts of each field will produce higher crop yield than other parts because the better soils have higher water holding capacity (e.g. higher clay content, higher organic matter). In the high yielding zones, there is less residual soil nitrate remaining in the soil profile. Drought will create more variability in crop yield and residual soil nitrate, mostly driven by topography and soil texture.

Let’s imagine you had a wheat crop severely affected by drought, but some parts of the field still had 50% normal yield (maybe lower landscape positions, greater water holding capacity). Following harvest, the whole-field composite soil test showed 140 lb/acre nitrate-N (0-24 inch). You were skeptical about that very high residual soil nitrate level, so the crop consultant resampled the parts with better crop yield, which then had 80 lb/acre nitrate-N (0-24 inch). Using the whole-field composite soil test result of 140 lb/acre nitrate-N (0-24 inch), you would only need to apply some starter nitrogen fertilizer for next year’s crop. However, if you only applied starter nitrogen, the high yielding parts of the field with only 80 lb/acre nitrate-N (0-24 inch) would be under-fertilized, costing crop yield and profit next year, on the best soils in the field.

If you only have a whole-field composite soil test result, you must consider spatial variability in residual soil nitrate across the field. You will want to apply a base nitrogen fertilizer rate to cover the parts with lower residual soil nitrate than the field average. The base nitrogen fertilizer rate may range between 30 to 60 lb/acre N, depending on spatial variability and risk tolerance. If you do zone soil sampling, you have a much better idea of spatial variability and nitrogen fertilizer needs in all parts of your fields. Through productivity zone soil sampling, you know the residual soil nitrate level in each management zone, and you can choose different nitrogen fertilizer rates across the field.

If you only soil sample the surface soil depth (0-6 inch), you are missing 75% of the plant-available nitrate-nitrogen pie. To make good nitrogen decisions, you should collect 0-24 inch soil samples for soil nitrate-nitrogen analysis. In drought, plant roots explore deep for stored soil water and uptake whatever nitrate is found along the way. There is no way to model how much soil nitrate remains in the soil profile after drought. Following drought, the best strategy is 24-inch soil sampling and breaking fields into several management zones to determine the proper amount of nitrogen fertilizer required.