Adjusting high soil pH and salinity with sugar beet-processing spent lime

The sugar beet processing industry uses large quantities of fine-ground, high-grade calcium carbonate (lime) to purify sucrose in the sugar extraction process. The by-product spent lime retains high reactivity and purity, making it an attractive liming material for acidic soils. Application of spent lime is a common practice through the sugar beet producing areas of the upper Midwest and northern Great Plains, where its primary function is the suppression of the soil-borne disease Aphanomyces root rot of sugar beet. The spent lime also contains about 20 lb P2O5 per ton, mostly as organic phosphorus impurities gained from sugar refining.

We often get questions about correcting high soil pH and salinity with spent lime. Salt-affected soils, saline and sodic, are a common problem across the northern Great Plains. These soils have high soil pH and present numerous agronomic and soil management problems. The soil amendment gypsum (calcium sulfate) is often applied to sodic soils (those with high sodium) to combat soil swelling and dispersion. The spent lime (calcium carbonate) also contains calcium, but it is very insoluble at high soil pH.

Each year, we get many questions about applying spent lime on soils with high pH and salinity. To answer these questions, AGVISE Laboratories installed a long-term demonstration project in 2008 to evaluate adjusting high soil pH and salinity with spent lime. We applied multiple spent lime rates and tracked soil test levels over seven years. There were no significant changes or trends in soil pH (Table 1) or salinity (Table 2). This is no surprise because the initial soil pH was high and buffered around 7.8-8.2, indicating the presence of natural calcium carbonate. If the soil already contains naturally occurring lime, what is the good of adding more lime? Moreover, calcium carbonate is very insoluble, so there is no expectation that more lime will decrease or increase salinity.

Since soil test levels did not change over seven years, we terminated the project in 2014. The research question was a conclusive dud. While spent lime is useful to amend acidic soils and suppress Aphanomyces root rot of sugar beet, it does not help on soils with high pH or salinity.


Table 1. Soil pH (1:1) following sugar beet-processing spent lime application on high pH soil.
Spent Lime Year Average
2008 2009 2010 2011 2012 2013 2014
ton/acre
1 7.8 7.7 7.9 7.8 7.7 8.0 8.0 7.80
2 7.9 7.9 8.1 7.9 7.9 8.0 8.0 7.94
3 7.9 7.9 8.1 7.9 7.9 8.1 8.1 7.95
4 7.8 7.8 7.9 7.7 7.8 8.1 8.0 7.85
5 7.8 7.8 8.0 7.9 7.9 8.0 8.0 7.90
6 8.0 7.9 8.2 8.0 8.0 8.1 8.1 8.00
Spent lime applied and incorporated September 2008. Soil sampled in fall.


Table 2. Soil salinity (electrical conductivity, EC 1:1) following sugar beet-processing spent lime application on moderately saline soil.
Spent Lime Year
2008 2009 2010 2011 2012 2013 2014
ton/acre ——————— dS/m ———————
1 1.5 1.2 1.8 1.1 1.6 1.2 1.8
2 1.9 2.1 2.3 2.5 2.3 2.0 2.0
3 1.9 2.2 2.6 2.5 2.4 1.9 1.9
4 1.0 1.3 1.4 1.2 1.5 1.9 1.9
5 1.7 2.2 2.2 2.3 2.2 1.7 1.7
6 2.6 2.1 2.1 2.9 2.5 1.9 1.9
Spent lime applied and incorporated September 2008. Soil sampled in fall.

Adjusting low soil pH with sugar beet-processing spent lime

The sugar beet processing industry uses large quantities of fine-ground, high-grade calcium carbonate (lime) to purify sucrose in the sugar extraction process. The by-product spent lime retains high reactivity and purity, making an attractive liming material for acidic soils. Application of spent lime is a common practice through the sugar beet producing areas of the upper Midwest and northern Great Plains, where its primary function is the suppression of the soil-borne disease Aphanomyces root rot of sugar beet. The spent lime also contains about 20 lb P2O5 per ton, mostly as organic phosphorus impurities gained from sugar refining.

AGVISE Laboratories installed a long-term demonstration project in 2014 to evaluate adjusting low soil pH with spent lime. The project site was located near our Northwood Laboratory. Northwood lies along the beachline of glacial Lake Agassiz, where well-drained coarse-textured soils with low pH are common. We located a very acidic soil with soil pH 4.7 (0-6 inch), which was the perfect site to evaluate lime application. In May 2014, spent lime was applied and incorporated with rototiller. The spent lime quality was very high at 1,500 lb ENP/ton. In Minnesota, lime quality is measured as effective neutralizing power (ENP), which measures lime purity and fineness. Soil pH was tracked over three years (Table 1).

The lowest spent lime rate (2,500 lb ENP/acre) increased soil pH above 5.5. This soil pH reduced aluminum toxicity risk, but it did not reach the target pH 6.0, appropriate for corn-soybean rotation. The highest spent lime rate (10,000 lb ENP/acre) increased soil pH above 7.0 and maintained soil pH for several years. Spent lime is a fine-ground material with high reactivity, so its full effects were seen in the first application year. The project showed that spent lime is an effective liming material for low pH soils.

Table 1. Soil pH (1:1) following sugar beet-processing spent lime application on low pH soil.
Spent Lime Year
May 2014 Sept 2014 July 2015 June 2016
lb ENP/acre
0 4.8 4.8 4.7 5.1
2,500 4.8 5.5 5.2 5.4
5,000 4.8 5.6 5.7 5.5
10,000 4.8 7.4 7.0 7.4
Spent lime applied and incorporated September 2008. Soil sampled in fall.

The Meaning of Soil Health Testing and the Big Picture

This submission is courtesy of Dr. Caley Gasch, Assistant Professor of Soil Health, North Dakota State University, Fargo, ND. It was originally published in the AGVISE Newsletter Winter 2017.

Multiple definitions of “soil health” exist. In general, they all recognize that soil is a complex system, with interacting physical, chemical, and biological factors, which should be managed in a manner that sustains its function and integrity over the long term. Conceptually, soil health is a topic that is easy to understand and support.

Yet, it has been difficult to capture this definition with measurements. Soil scientists can choose from hundreds of field- or laboratory-based methods to quantify different properties in the soil, but there is no single best test for assessing soil health. Research and commercial labs and focus groups across the country have compiled lists of properties that are being used to assess soil health, but we still have a lot to learn about how these suites of measurements can guide management decisions.

As much as we desire hard numbers that support the concept of soil health, I argue that we should keep the big picture in mind. Last summer, I heard a perfect analogy that demonstrates the disparity between the concept of soil health and the push for soil health testing. The idea solidified for me on a recent doctor visit.

You visit your doctor for a routine check-up. The doctor will ask you about your lifestyle: How often do you exercise? Do you smoke? What do you eat? How many drinks do you have per week? Which medications are you taking? What is your family history? They’ll take your weight, pulse, blood pressure, and temperature. They may order a few more tests, and they’ll most likely give you some advice: Wear sunscreen, eat more oatmeal, and come back in a year.

The doctor learns something from your vital signs and can compare them to the past; however, the doctor learns more about your overall health after understanding your eating habits and levels of activity. After all, it wouldn’t be good practice for the doctor to prescribe blood pressure medication solely based on a single blood pressure reading, or claim to know your heart condition based on your pulse alone (what if you ran up a flight of stairs on your way to the doctor’s office?). You are not given a mathematical health score or rank. The doctor knows that your body is a complex system, and that to understand its overall condition, we need to consider how you care for yourself, any risky behaviors, and the results of some routine tests. Certainly, if you have a specific complaint, or if the doctor identifies a particular problem, appropriate tests are available to diagnose and monitor the malady.

I propose that we take a similar approach to soil health. First, understand the “lifestyle” of a soil: What is the rotation? What kind of tillage do you use and how frequently? Do you ever use cover crops? What is your fertility plan? What are the “genetic” limitations of the soil? Second, identify specific barriers to overall health: salinity, erosion, poor drainage, disease issues, etc. Third, identify areas for improvement, address them with a lifestyle adjustment, and develop a monitoring plan to track specific problem areas, realizing that it may take a few years to see change.

For humans and soils alike, we know that there are certain risk factors associated with health and condition. We know a great deal about how practices influence soil properties,
and we don’t usually need a test to detect whether or not a practice is healthy. The testing becomes meaningful only after we focus on a specific challenge area, which will differ from person to person and from field to field. Targeted testing and acute treatments are useful and necessary, but they should not be the basis for managing a complex system.

I’m grateful that soil health is a popular topic, because it is helping us all to think about soil in a way that recognizes its true value and potential. But I challenge us to remember our overall goal for soil health, rather than focusing solely on the vital signs. Approach each field with a broad view, understanding that it is a unique case that reflects its own history and management. From this perspective, we can identify and adopt practices that will protect our soil and improve its value throughout our region.

Adjusting high soil pH with elemental sulfur

Soil pH is a soil chemical property that measures soil acidity or alkalinity, and it affects many soil chemical and biological activities. Soils with high pH can reduce the availability of certain nutrients, such as phosphorus and zinc. Soils of the northern Great Plains and Canadian Prairies often have high soil pH (>7.3) and contain calcium carbonate (free lime) at or near the soil surface. It is the calcium carbonate in soil that maintains high soil pH and keeps it buffered around pH 8.0. The calcium carbonate originates from soil formation processes since the latest glacial period.

An unfounded soil management suggestion is that soil pH can be successfully reduced by applying moderate rates of elemental sulfur (about 100 to 200 lb/acre elemental S). Elemental sulfur must go through a transformation process called oxidation, converting elemental sulfur (S0) to sulfuric acid (H2SO4), a strong acid. Sulfuric acid does lower soil pH, but the problem is the amount of carbonate in the northern region, which commonly ranges from 1 to 5% CCE and sometimes over 10% CCE. Soils containing carbonate (pH >7.3) will require A LOT of elemental sulfur to neutralize carbonate before it can reduce soil pH.

To lower pH in soils containing carbonate, the naturally-occurring carbonate must first be neutralized by sulfuric acid generated from elemental sulfur. You can visualize the fizz that takes place when you pour acid on a soil with carbonate. That fizz is the acid reacting with calcium carbonate to produce carbon dioxide (CO2) gas. Once all calcium carbonate in soil has been neutralized by sulfuric acid, only then can the soil pH be lowered permanently. It is important to note that sulfate-sulfur sources, such as gypsum (calcium sulfate, CaSO4), do not create sulfuric acid when they react with soil, so they cannot neutralize calcium carbonate or change soil pH (Figure 1).

Figure 1. Soil pH following gypsum application on soil with high pH and calcium carbonate.

In 2005, AGVISE Laboratories installed a long-term demonstration project evaluating elemental sulfur and gypsum on a soil with pH 8.0 and 2.5% calcium carbonate equivalent (CCE). The highest elemental sulfur rate was 10,000 lb/acre (yes, 5 ton/acre)! We chose such a high rate because the soil would require a lot of elemental sulfur to neutralize all calcium carbonate. Good science tells us that 10,000 lb/acre elemental sulfur should decrease soil pH temporarily, but it is still not enough to lower soil pH permanently. In fact, this is exactly what we saw (Figure 2). Soil pH declined in the first year, but it returned to the initial pH over subsequent years because the amount of elemental sulfur was not enough to neutralize all calcium carbonate.

Figure 2. Soil pH following elemental sulfur application on soil with high pH and calcium carbonate.

A quick calculation showed that the soil with 2.5% CCE would require about 16,000 lb/acre elemental sulfur to neutralize all calcium carbonate in the topsoil. Such high rates of elemental sulfur are both impractical and expensive on soils in the northern Great Plains. The only thing to gained is a large bill for elemental sulfur. While high soil pH does lower availability of phosphorus and zinc, you can overcome these limitations with banded phosphorus fertilizer and chelated zinc on sensitive crops. All in all, high soil pH is manageable with the appropriate strategy. That strategy does not involve elemental sulfur.

Soil Salinity Analysis: Which method to choose?

This submission is courtesy of Dr. Heather Matthees, Research Soil Scientist, USDA-ARS, Morris, MN. It was originally published in the AGVISE Newsletter Fall 2017.

Salt-affected soils are a major problem for agricultural producers, resulting in $12 billion annual losses in crop production across the world. In the northern Great Plains and Canadian Prairies, soil salinity has always existed in some soils of the region, but the problem has become more widespread and severe since a hydrological wet period began in the 1990s.

Salinity is the overall abundance of soluble salts, which compete with plant water uptake and reduce crop productivity. The soluble salts pull soil water toward themselves in the soil solution, which leaves less soil water available for plant uptake. This causes an apparent drought stress, reducing crop productivity and sometimes may kill the plant. Soluble salts are naturally occurring and a product of regional geology in the northern Great Plains and Canadian Prairies. Since the 1990s, the hydrological wet period has raised the groundwater level and allowed saline groundwater to rise toward the soil surface, causing soil salinization. Saline soils are often called “salty,” “sour”, or “white alkali.”

The severity of soil salinity will control which plant species are suitable for crop or forage production. Some crop species like dry bean and soybean are very sensitive to salinity, whereas other crop species like barley and sunflower have good tolerance to salinity. For soils with very high salinity, the only practical forage option may be salt-tolerant perennial grasses. To assess soil salinity, there are two soil analysis methods: saturated paste extraction and routine 1:1 soil water methods.

Saturated Paste Extraction Method

The gold standard in soil salinity research is the saturated paste extraction method. The method requires a trained laboratory technician to mix soil and water into a paste, just reaching the saturation point, which is about the consistency of pudding. The saturated paste rests overnight to dissolve the soluble salts. It is then is placed under vacuum to draw the saturated paste extract. Soil salinity is then determined by measuring the electrical conductivity (EC) of the saturated paste extract.

The saturated paste extraction method is fairly straightforward, but it requires a trained technician, specialized equipment, and over 24 hours to complete the procedure. The procedure is labor intensive and difficult to automate, so it is considered a special analysis service in commercial soil testing. Therefore, it is more expensive than routine soil testing methods. Among soil salinity determination methods, it is considered the most accurate because the soil:water ratio at saturation controls for differences in soil texture and water holding capacity.

Routine 1:1 Soil:Water Method

The routine method for soil salinity assessment is the 1:1 soil:water method, which mixes standard mass of soil (10 g) and volume of water (10 mL) in a soil-water slurry. Soil salinity is then determined by measuring the electrical conductivity (EC) of the soil-water slurry. It is most commonly abbreviated EC1:1.

The method is fast and inexpensive (only 5-10% of saturated paste extraction cost). The low cost per soil sample allows a person to collect more soil samples from various soil depths and multiple locations within a field (e.g. zone soil sampling), which can create a more comprehensive and detailed soil salinity map to evaluate soil salinity presence, severity, and variability. Since soil salinity is so intimately related to soil water movement across the landscape, the soil salinity map also provides information about soil water accumulation and leaching, soil nutrient movement (e.g. chloride, nitrate-nitrogen, sulfate-sulfur), and crop productivity potential.

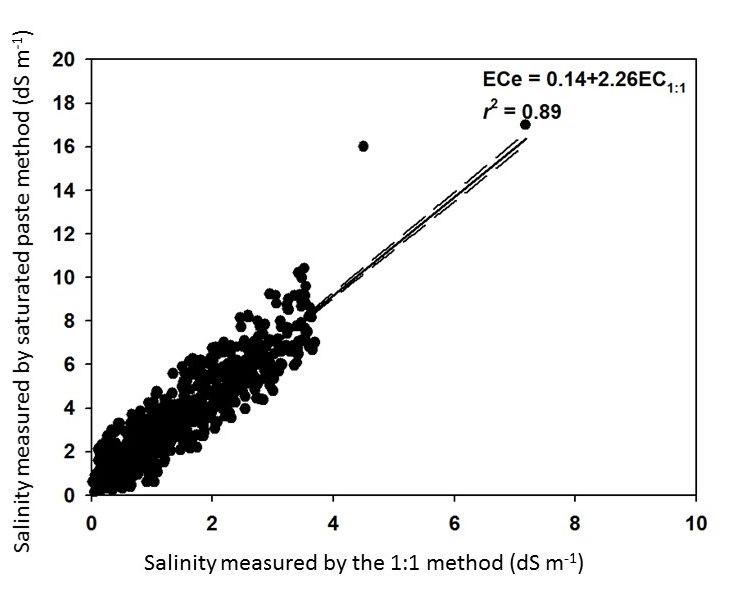
A general caveat about the 1:1 soil:water method is that the reported values will be lower than the saturated paste extraction method. Fortunately, the two methods are highly correlated. AGVISE Laboratories worked with soil science researchers at North Dakota State University and South Dakota State University to validate the correlation between the two methods using over 2,300 soil samples from the northern Great Plains. You can convert the two methods by multiplying the 1:1 soil:water result by 2.26 to estimate the saturated paste extraction result (Figure 1).

The simple method conversion enables you to quickly and cheaply monitor soil salinity using the 1:1 soil:water method and still utilize the historical soil salinity interpretation criteria based on the saturated paste extraction method.

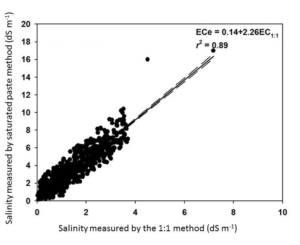
Figure 1. Soil salinity method conversion between saturated paste extraction and 1:1 soil:water methods.

References

Matthees, H. L., He, Y., Owen, R. K., Hopkins, D., Deutsch, B., Lee, J., Clay, D. E., Reese, C., Malo, D. D., & DeSutter, T. M. 2017. Predicting soil electrical conductivity of the saturation extract from a 1:1 soil to water ratio. Communications in Soil Science and Plant Analysis, 48(18), 2148–2154.

Prevented Planting Acres in 2020: Maximizing Cover Crop Effectiveness

In 2020, there are again widespread acres of Prevented Planting (PP) in North Dakota and northwest Minnesota. Farmers are now making plans to plant cover crops on unplanted cropland in the next few weeks. It is important to establish cover crops on PP fields because growing plants help reduce the chance these fields will be PP fields again next year.

Let’s look at the major reasons why cover crops are valuable tools on Prevented Planting acres.

Soil Water Use

A field without any growing plants is a fallow field. Before no-till, summer fallow was a widespread soil water conservation strategy in dryland agriculture. Actively growing plants transpire (use) a lot more water than evaporation from the soil surface alone does. Cover crops help fill the water-use void by transpiring a lot of water, helping to dry the soil surface and lower the water table before the following year. This also opens space in the soil profile for summer and fall rains to leach soluble salts from the soil surface and reduce salinity in the root zone.

Soil Erosion Control

Tillage is a popular weed control tool, but it also destroys crop residue and leaves soil exposed and vulnerable to water and wind erosion. Planting cover crops protects the soil surface from rain and wind, keeping soil firmly in place. Just because you cannot grow a cash crop on the field this year, you should not let your soil blow into the next field, letting your neighbor farm it next year.

Weed Control

An established cover crop can compete with weeds, helping suppress weed growth and weed seed production. For fields with problematic broadleaf weed histories, a cover crop mix containing only grass species is preferred. In grass cover crops, you can still use selective broadleaf weed herbicides to control the problematic broadleaf weeds of conventional or no-till systems such as Canada thistle, common ragweed, kochia, volunteer canola, and waterhemp while not killing the grass cover crop. For fields with low weed pressure, a cover crop mix containing grasses, brassicas, and legumes will provide more soil health benefits.

Soil Biological Activity

Have you heard about “fallow syndrome” before? Fallow syndrome is an induced nutrient deficiency, often seen in corn following fallow, when the population of mycorrhiza fungi is insufficient to colonize plant roots and help them acquire water and nutrients. Mycorrhizae are especially important in plant uptake of phosphorus, so plants with fallow syndrome often show phosphorus deficiency symptoms. Fallow syndrome is a major concern in corn following summer fallow or Prevented Planting without cover crop.

During the Prevented Planting year, it is important to include grass species in the cover crop mix to support and maintain the mycorrhiza population through next year. Brassica species, like radish and turnip, are often included in cover crop mixes for their deep taproot architecture and high forage value for grazing livestock, but brassicas do not support mycorrhizae. You do not want a cover crop mix consisting of brassica species alone because fallow syndrome might occur next year.


In June 2020, excessive rainfall slammed some parts of the upper Midwest and northern Great Plains, drenching soils with 3 to 15 inches of rain over a couple days. On summer-flooded fields, cereal rye is an attractive soil management tool. You can plant or fly on cereal rye well into August or mid-September, and it will continue to use soil water through late summer and fall. Next spring, the overwintered rye will grow again, using more soil water and maintaining soil structure, providing you with a much better chance to plant the field. If soybean is the next crop, you can plant glyphosate-tolerant soybean into green cereal rye then terminate the cereal rye with glyphosate later. This practice has become more and more popular on difficult fields.

Do not forget about soil fertility and plant nutrition for cover crops. A modest application of nitrogen will help cover crop establishment, plant water use, and competition with weeds, as cover crops with adequate nitrogen will grow faster and larger than those without nitrogen. Around 46 lb/acre nitrogen (100 lb/acre urea, 46-0-0) should be enough to establish nice cover crop growth. Prevented Planting fields, being wetter than those successfully planted in spring, lost some, if not most, soil nitrogen via nitrate leaching or denitrification. Although additional nitrogen may have mineralized from soil organic matter during May and June, excess precipitation in June may have caused additional soil nitrogen loss. The best way to know is collecting 0-12 or 0-24 inch soil samples for nitrate-nitrogen analysis.

As you choose the appropriate cover crop mix on Prevented Planting fields, you must consider the pros and cons of each cover crop species and how each will help accomplish your goals. These are some helpful resources that will provide additional information on what cover crop options will work best on your fields.