Soil sampling on drown-out, unplanted, and Prevented Planting acres
Across the northern Great Plains and Canadian Prairies, weather patterns have ranged from too dry to too wet. For the too wet parts, excessive spring and summer rainfall has resulted in extensive stretches of unplanted (Prevented Planting) acres or drown-out acres. As people think about the fall soil sampling season ahead, we are starting to get questions about these unplanted or drown-out fields: When can I start soil sampling? What kind of residual soil nitrate-nitrogen amounts can I expect in the fall?
Extremely wet soil conditions can cause soil nitrogen losses to leaching or denitrification. Warmer soil temperatures and good soil moisture can promote more nitrogen mineralization from soil organic matter. Fallow fields without growing crops (or weeds) can accumulate nitrogen in the soil profile. There are a lot of variables in the equation, and soil testing is the only way to know how much nitrate-N is actually present in the soil profile. Sorry, no points for guessing! The soil nitrate-N level will depend on numerous management and environmental factors, which vary from field to field and zone to zone.
Management Factors
- Did you apply nitrogen with intent to plant the field? What was the nitrogen fertilizer rate and application timing? Was it applied last fall?
- Did you do any summer tillage? More tillage promotes nitrogen mineralization.
- How was your weed control? Did the weeds get large and acquire a lot of nitrogen from the soil profile?
- Did you plant a cover crop to take up excess water (and nitrogen)?
Environmental Factors
- Did excessive rainfall cause nitrate leaching on well drained soils?
- Did excessive rainfall cause denitrification on poorly drained soils?
- Were summer temperatures warm? Warm temperatures promote nitrogen mineralization.
For immobile soil nutrients (e.g., P, K, Zn), you could start soil sampling anytime, as soon as you can collect good quality soil cores (not too muddy). If these nutrients were applied the previous fall or spring, a soil test will reflect their current availability in soil, following any fixation reactions and nutrient uptake from cover crop or weed growth. For soil nitrate-N, however, the timing will depend on tillage, nitrogen mineralization, and nitrogen uptake from cover crops and weeds.
For “clean” fallow fields (no cover crop or weeds), soil testing may begin in mid-August. It is important to prioritize soil sampling on fallow fields while you can still drive across them. Since these fallow fields have no plant growth to use excess water through fall, the field trafficability might become challenging if excess precipitation continues into fall. To help ensure you can collect good quality soil samples on fallow fields, start soil sampling in August and early September.
For fields with cover crops, soil testing should be delayed until the cover crop is terminated or growth has slowed and nitrogen uptake has stopped. A healthy cover crop can take up a lot of nitrogen through the fall, so you do not want to collect soil samples for nitrate-N too early. In NDSU cover crop projects, fall-planted cover crop mixes can contain 100 to 150 lb/acre N in the plant biomass, which is a sizeable amount of nitrogen that would not be measured as soil nitrate-N.
AGVISE has also performed fallow and cover crop comparison projects; we have seen 35 to 90 lb/acre nitrate-N differences in the 0-24 inch soil profile between fallow and cover crop areas of the same field (Figure 1). To best reflect the amount of residual soil nitrate-N available for next year, it is suggested to wait until cover crop nitrogen uptake has slowed or stopped in October. If more precipitation arrives in fall, the cover crop will continue to use excess soil water and also provide a nice plant residue surface to drive on.
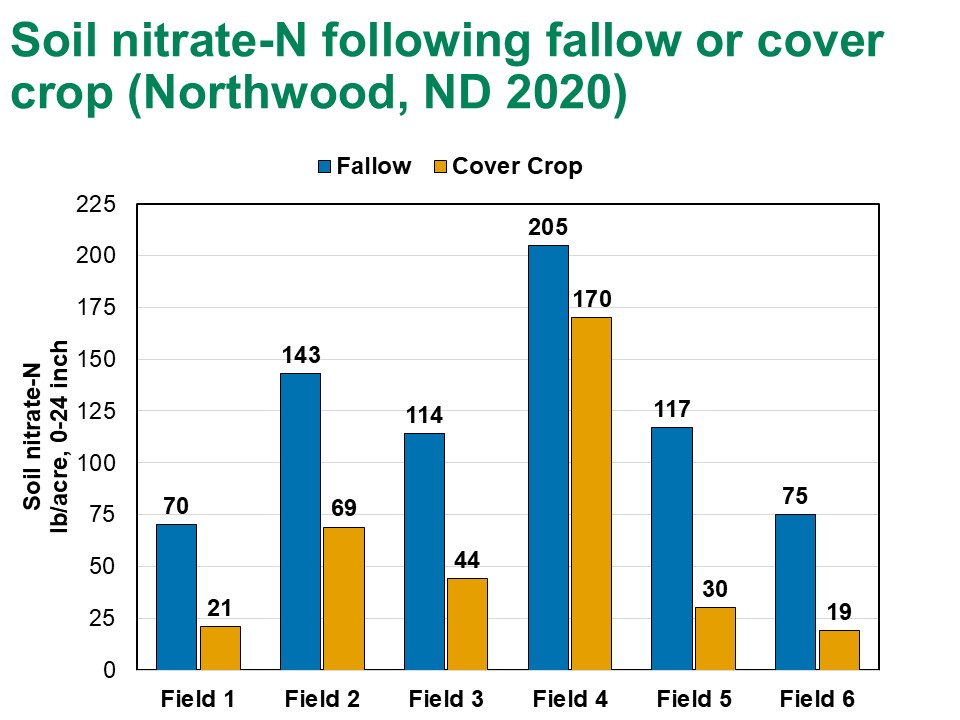
Figure 1. Soil nitrate-N following fallow or cover crop. Cover crop planted in August; soil samples collected in October. AGVISE Laboratories, Northwood, ND. 2020.
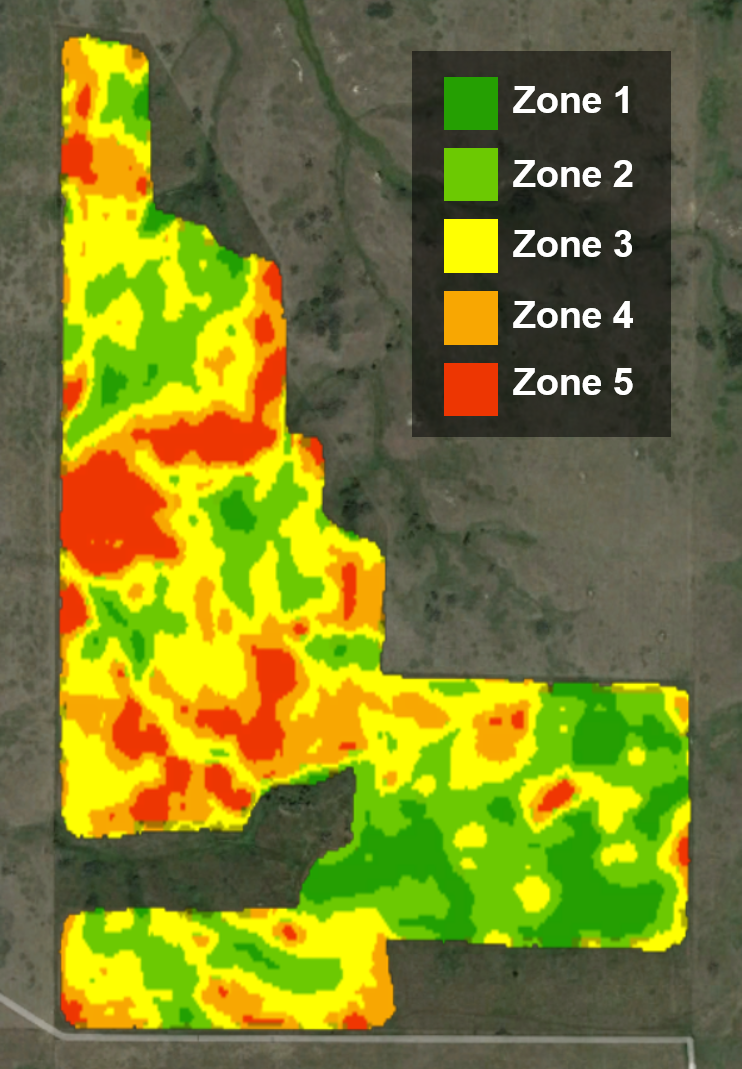
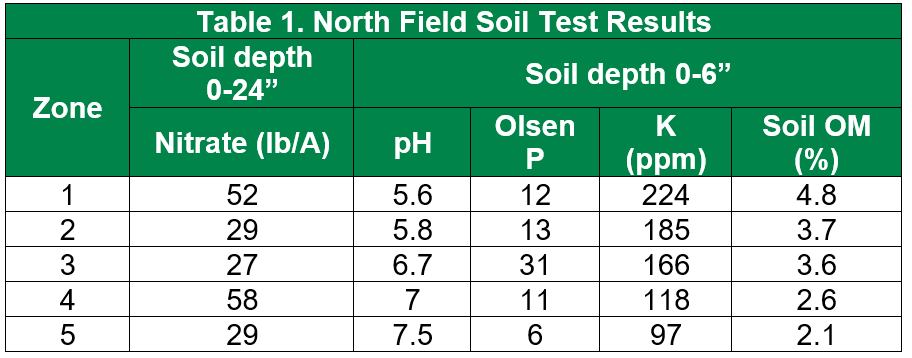
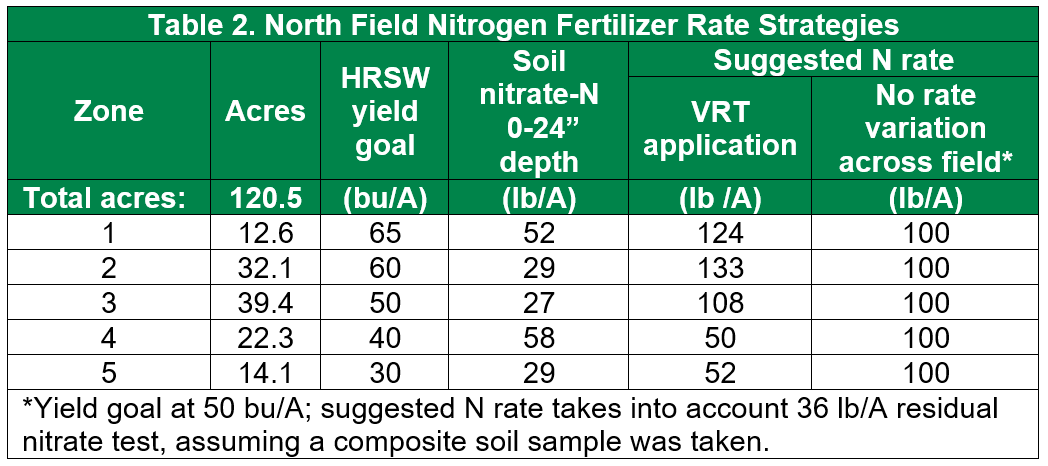
We also recommend splitting fields into management zones for soil testing. The unplanted or drown-out parts of the field can very considerably from the rest of the field, which will skew the field-average soil test result and resulting nitrogen fertilizer rate for next year. Often, the unplanted or drown-out parts will have higher soil nitrate-N (no nitrogen uptake), but sometimes the situation is oddly reversed for no good reason (Figure 2). This data highlights the importance of collecting separate soil samples for the planted and unplanted/drown-out parts of the field.
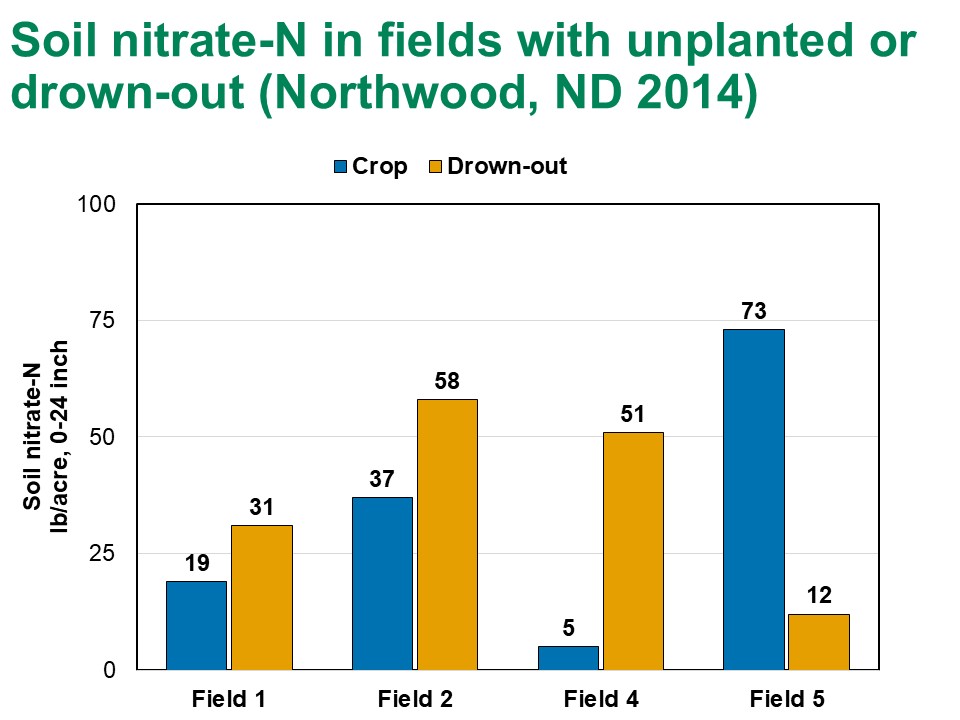
Figure 2. Soil nitrate-N variability in fields with unplanted or drown-out areas. Paired soil samples in close proximity from the cropped and unplanted/drown-out area in the same field. AGVISE Laboratories, Northwood, ND. 2014.