Sidedress Corn Using the Pre-sidedress Soil Nitrate Test (PSNT)

As the corn crop begins to emerge, it is time to prepare for sidedress nitrogen applications. Sidedress nitrogen for corn can be applied any time after planting, but the target window is generally between growth stages V4 and V8, before rapid plant nitrogen uptake occurs. Split-applied nitrogen has become a standard practice in corn to reduce in-season nitrogen losses on vulnerable soils, such as sandy and clayey soils. More and more farmers now include topdress or sidedress nitrogen as part of their standard nitrogen management plan. These farmers have witnessed too many years with high in-season nitrogen losses through nitrate leaching or denitrification.

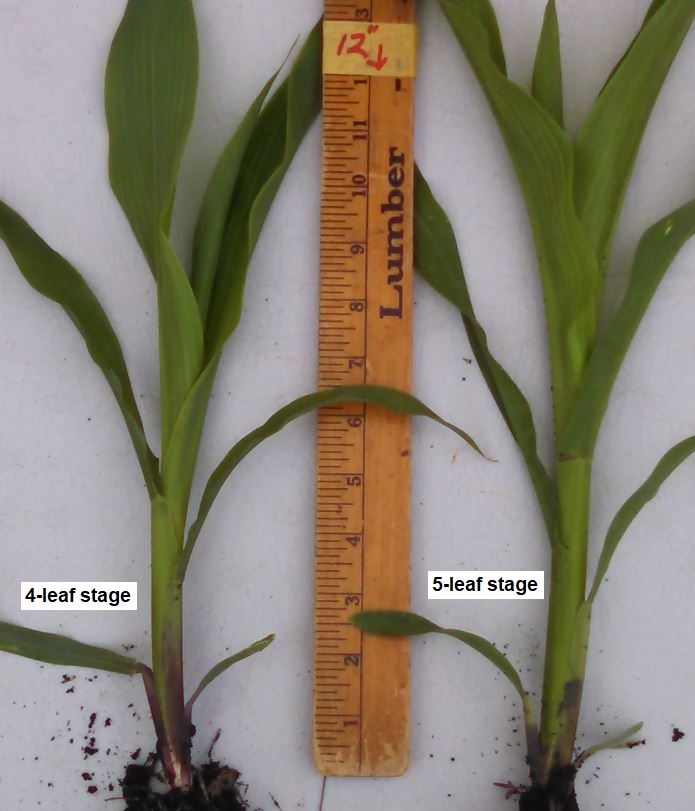
The target timing for PSNT sampling is when corn is 6 to 12″ tall. Twelve-inch corn is often V4 or V5 (like in the picture above). Do not hesitate in collecting soil samples for the PSNT; the target window for sidedress-nitrogen applications in corn is between the V4 and V8 stages. 

Whether your nitrogen management plan includes a planned sidedress nitrogen application or not, the Pre-Sidedress Soil Nitrate Test (PSNT) is one tool to help make decisions about in-season nitrogen. You may also hear this test called the Late-Spring Soil Nitrate Test (LSNT) in Iowa. PSNT is an in-season soil nitrate test taken during the early growing season to determine if additional nitrogen fertilizer is needed. PSNT helps assess available soil nitrate-nitrogen prior to rapid plant nitrogen uptake and the likelihood of crop yield response to additional nitrogen.

The Pre-sidedress Soil Nitrate Test (PSNT), taken when corn is 6 to 12 inches tall, can help you decide the appropriate sidedress nitrogen rate. The PSNT requires a 0-12 inch depth soil sample taken when corn plants are 6 to 12 inches tall (at the whorl), usually in late May or early June. Late-planted corn may not reach that height before mid-June, but PSNT soil samples should still be collected during the first two weeks of June. The recommend soil sampling procedure requires 16 to 24 soil cores taken randomly through the field, staggering your soil cores across the row as you go. All soil cores should be placed in the soil sample bag and submitted to the laboratory within 24 hours or stored in the refrigerator.

You can submit PSNT soil samples using the online AGVISOR program by choosing the “Corn Sidedress N” crop choice and submitting a 0-12 inch soil sample for nitrate analysis. AGVISOR will generate sidedress nitrogen fertilizer guidelines, using the PSNT critical level of 25 ppm nitrate-N (0-12 inch depth). If PSNT is greater than 25 ppm nitrate-N, then the probability of any corn yield response to additional nitrogen is low. If spring rainfall was above normal, then the PSNT critical level of 20 to 22 ppm nitrate-N (0-12 inch depth) should be used. Iowa State University provides additional PSNT interpretation criteria for excessive rainfall, manured soils, and corn after alfalfa.

If the PSNT is taken after excessive rainfall, the soil cores will be wet and difficult to mix in the field. Therefore, it is best to send all soil cores to the laboratory to be dried and ground, ensuring a well-blended soil sample for analysis. Although in-field soil nitrate analyzers have improved over the years, the difficult task of blending wet, sticky soil cores in the field still remains. The only way to get accurate, repeatable soil analysis results is to dry, grind, and blend the entire soil sample in the laboratory before analysis. AGVISE provides 24-hour turnaround on PSNT soil samples. The soil samples are analyzed and reported the next business day after arrival. Soil test results are posted on the online AGVISOR program for quick and easy access. With AGVISE, you get not only great service but also the highest quality data with four decades of soil testing experience.

Pre-Sidedress Soil Nitrate Test (PSNT) resources

Please call our technical support staff if you have any questions on PSNT and interpreting the soil test results for sidedress nitrogen application.

Starter Fertilizer: Choosing the Right Seed-Safe Rate

Starter fertilizer placed with or near the seed is essential for vigorous early season growth in grass crops such as corn and wheat. We plant these crops early because we know vigorous early season growth is important to achieving high crop yields. Early planting also means cold soils, and starter fertilizer is necessary to get the crop going with a good start. Each spring, we receive many questions about starter fertilizer placement and seed-safe fertilizer rates. These questions come from farmers who want to plant as many acres per day as possible, take advantage of more efficient banded phosphorus placement, and of course reduce fertilizer costs.

The two most common questions we get are “What is highest rate of starter fertilizer I can apply with the seed?” and “What is the lowest rate of starter fertilizer I can apply with the seed and still get a starter effect?” South Dakota State University (SDSU) made a downloadable spreadsheet that calculates the maximum seed-safe fertilizer rate (Figure 1). The spreadsheet will ask for the crop choice, fertilizer product, seed opener width, row spacing, tolerable stand loss, soil texture, and soil water content. The spreadsheet calculations are based on SDSU greenhouse and field studies.

Seed Safety Calculator from SDSU for Starter Fertilizer Article

Figure 1. Fertilizer Seed Decision Aid from South Dakota State University. Download the spreadsheet here

Research has shown, that to achieve the full starter effect, a fertilizer granule or droplet must be within 1.5 to 2.0 inches of each seed. If the fertilizer granule or droplet is more than 1.5 to 2.0 inches away from the seed, the starter effect is lost. To illustrate the role of starter fertilizer rates and seed placement, AGVISE created displays showing the distance between fertilizer granules or droplets at various rates and row spacings. For example, take a look at wheat planted in 7-inch rows with 30 lb/acre P2O5 (57 lb/acre 11-52-0) and corn planted in 30-inch rows with 30 lb/acre P2O5 (7.5 gal/acre 10-34-0). You need to maintain a sufficient starter fertilizer rate to keep fertilizer granules or droplets with 1.5 to 2.0 inches of each seed.

Starter fertilizer demonstration example for starter fertilizer article

Figure 2. Two examples from the AGVISE Starter Fertilizer Display series. Find more crops and fertilizer rates here.

In the northern Great Plains and Canadian Prairies, most fertilizer is applied at planting and often as seed-placed fertilizer. This creates a challenge to prevent soil nutrient mining when balancing seed safety and crop nutrient removal with higher crop yield potential. Soil nutrient mining occurs when you apply less fertilizer than crop nutrient removal, resulting in soil test P and K decline over time. Some broadleaf crops, like canola and soybean, are very sensitive to seed-placed fertilizer, allowing only low seed-placed fertilizer rates. In contrast, most cereal crops can tolerate higher seed-placed fertilizer rates. To maintain soil nutrient levels across the crop rotation, you need to apply more phosphorus fertilizer in crops that allow greater seed safety. You can apply more phosphorus fertilizer with crops like corn or wheat, which allows you build soil test P in those years, while you mine soil test P in canola or soybean years. If you cannot the maintain crop nutrient removal balance with seed-placed fertilizer, then you need to consider applying additional phosphorus in mid-row bands or broadcast phosphorus at some point in the crop rotation.

Table 1. Seed-safe fertilizer rates may not meet crop removal. In the example, the seed-safe limit is based on 1-inch disk or knife opener and 7.5-inch row spacing for air-seeded crops and 30-inch row spacing for corn. Phosphorus (P) balance: Seed-safe limit (lb/acre P2O5) minus crop P removal (lb/acre P2O5). A negative P balance indicates the seed-safe limit does not meet crop removal, which may decrease soil test P.

Starter fertilizer is an important part of any crop nutrition plan. Here are more resources to help you make the best decisions on starter fertilizer materials, placement, and rates.

Fertilizer Application with Small Grain Seed at Planting, NDSU

Safe Rates of Fertilizer Applied with the Seed, Saskatchewan Agriculture

Using banded fertilizer for corn production, University of Minnesota

Corn response to phosphorus starter fertilizer in North Dakota, NDSU

Starter Fertilizer Display: How low can YOU go?

When profits are squeezed, more farmers are asking about optimal starter fertilizer rates and how low starter fertilizer rates can be. These questions are the result of wanting to keep fertilizer costs down, to plant as many acres per day as possible, and to take advantage of more efficient, lower rates of banded phosphorus fertilizer compared to higher rates of broadcast phosphorus fertilizer.

To illustrate the role of starter fertilizer rates and seed placement, we put together displays showing the distance between fertilizer granules or droplets at various rates and row spacings. You can see several pictures with canola, corn, soybean, sugar beet, and wheat. We greatly thank John Heard with Manitoba Agriculture for helping with the displays.

The displays show the normal seed spacing for several crops with different dry or liquid fertilizer rates alongside the seed. These displays help visualize the distance between the seed and fertilizer at several rates. University research shows that to achieve the full starter effect, a fertilizer granule or droplet must be within 1.5-2.0 inches of each seed. If the fertilizer granule or droplet is more than 1.5-2.0 inches away from the seed, the starter effect is lost. Some people wonder about these displays, but you can prove it to yourself pretty easily. Just run the planter partially down on a hard surface at normal planting speed. You will see what you imagine as a constant stream of liquid fertilizer, ends up being individual droplets at normal speed, especially with narrow row spacings and lower fertilizer rates.

These displays help illustrate the minimum starter fertilizer rate to maintain fertilizer placement within 1.5-2.0 inches of each seed for the full starter effect. In addition to an adequate starter fertilizer rate, additional phosphorus and potassium should be applied to prevent nutrient mining, causing soil test levels to decline in years when minimum fertilizer rates are applied.

Fertilizing grass lawn

A productive and lush lawn requires some fertilizer every now and then. The major plant nutrients required for grass lawn are nitrogen (N), phosphorus (P), and potassium (K). Nitrogen is the nutrient required in the largest amount, although too much nitrogen can create other problems. A general rate of one (1) pound nitrogen per 1,000 square feet is adequate for most grass lawns, but some more intensively managed lawns may require more nitrogen. The total annual nitrogen budget should be split through the year according to season (Table 1). Common cool-season grasses in lawn mixtures include Kentucky bluegrass, ryegrass, and fescues.

Table 1. Nitrogen fertilizer guidelines for established cool-season grass lawn.
Maintenance Intensity Early Spring

Mar – Apr

Spring

May – June

Summer

July – Aug

Early Autumn

Sept

Total Annual N
————————- lb nitrogen per 1000 square feet ————————-
Low,

no irrigation

0.5 0.5 0 0.5 1.5
Medium,

with irrigation

0.5 1.0 0.5 1.0 2.0
High,

with irrigation

0.5 1.0 1.0 2.0 4.5
Source: Bigelow, C. A., J. J. Camberato, and A. J. Patton. 2013. Fertilizing established cool-season lawns: Maximizing turf health with environmentally responsible programs. Purdue Univ. Ext. Circ. AY-22-W. Purdue Univ., West Lafayette, IN.

The nutrient application rates given in Table 1 are the actual nutrient rates. To calculate how much fertilizer product you require, you will convert the nutrient rate to fertilizer rate, using the labelled fertilizer analysis. The fertilizer analysis label reports the nitrogen-phosphorus-potassium concentration of the fertilizer product. A product with 12-4-8 analysis contains 12% N, 4% P2O5, and 8% K2O. To convert 1.0 lb N/1000 sq. ft, you divide the nutrient requirement by the fertilizer analysis (12% N), thus 1.0/0.12 equals 8.3 lb fertilizer/1000 sq. ft. The application rate of 12-4-8 fertilizer is 8.3 lb/1000 sq. ft.

A soil containing ample nitrogen may require less nitrogen fertilizer. If soil test nitrogen is more than 50 lb/acre nitrate-N (0 to 6 inch soil depth), the next nitrogen fertilization may be skipped. The soil test nitrogen value of 50 lb/acre nitrate-N is equal to 1.0 lb/1000 sq. ft nitrate-N.

Late fall is an optimal time to fertilize lawn, when grass growth has nearly stopped but before winter dormancy. Avoid fertilizing during hot summer months (July and August), unless you have ample irrigation. Controlled-release nitrogen fertilizer products applied in May and September help prolong nitrogen release to grass during critical growth periods in spring and fall.

Split the Risk with In-season Nitrogen

For some farmers, applying fertilizer in the fall is a standard practice. You can often take advantage of lower fertilizer prices, reduce the spring workload, and guarantee that fertilizer is applied before planting. As you work on developing your crop nutrition plan, you may want to consider saving a portion of the nitrogen budget for in-season nitrogen topdress or sidedress application.

Some farmers always include topdressing or sidedressing nitrogen as part of their crop nutrition plan. These farmers have witnessed too many years with high in-season nitrogen losses, usually on sandy or clayey soils, through nitrate leaching or denitrification. Split-applied nitrogen is one way to reduce early season nitrogen loss, but do not delay too long before rapid crop nitrogen uptake begins.

Short-season crops, like small grains or canola, develop quickly. Your window for topdress nitrogen is short, so earlier is better than later. To maximize yield in small grains, apply all topdress nitrogen before jointing (5-leaf stage). Any nitrogen applied after jointing will mostly go to grain protein. In canola, apply nitrogen during the rosette stage, before the 6-leaf stage. For topdressing, the most effective nitrogen sources are broadcast NBPT-treated urea (46-0-0) or urea-ammonium nitrate (UAN, 28-0-0) applied through streamer bar (limits leaf burn). Like any surface-applied urea or UAN, ammonia volatilization is a concern. An effective urease inhibitor (e.g. Agrotain, generic NBPT) offers about 7 to 10 days of protection before rain can hopefully incorporate the urea or UAN into soil.

Long-season crops, like corn or sunflower, offer more time. Rapid nitrogen uptake in corn does not begin until after V6 growth stage. The Pre-sidedress Soil Nitrate Test (PSNT), taken when corn is 6 to 12 inches tall, can help you decide the appropriate sidedress nitrogen rate. Topdress NBPT-treated urea is a quick and easy option when corn is small (before V6 growth stage). After corn reaches V10 growth stage, you should limit the topdress urea rate to less than 60 lb/acre (28 lb/acre nitrogen) to prevent whorl burn.

Sidedress nitrogen provides great flexibility in nitrogen sources and rates in row crops like corn, sugarbeet, or sunflower. Sidedress anhydrous ammonia can be safely injected between 30-inch rows. Anhydrous ammonia is not recommended in wet clay soils because the injection trenches do not seal well. Surface-dribbled or coulter-injected UAN can be applied on any soil texture. Surface-dribbled UAN is vulnerable to ammonia volatilization until you receive sufficient rain, so injecting UAN below the soil surface helps reduce ammonia loss. Injecting anhydrous ammonia or UAN below the soil surface also reduces contact with crop residue and potential nitrogen immobilization.

An effective in-season nitrogen program starts with planning. In years with substantial nitrogen loss, a planned in-season nitrogen application is usually more successful than a rescue application. If you are considering split-applied nitrogen for the first time, consider your options for nitrogen sources, application timing and workload, and application equipment. Split-applied nitrogen is another tool to reduce nitrogen loss risk and maximize yield potential.

AGVISE Potato Petiole Analysis: Informative, Accessible, and Easy-to-Understand Reports

For potato petiole analysis article

Irrigated potato production is an intensive cropping system. It requires proactive labor, critical decision-making tools, and well-timed nutrient management. There is a fine line between supplying adequate plant nutrition and applying too much, which could cause potato tuber defects like mishappen tubers or hollow heart, reducing the marketable potato yield.

Before seed potatoes go in the ground, potato agronomists begin with a good soil fertility plan based on precision soil sampling (grid or zone). Once potatoes have emerged, the next step is monitoring the soil and plant nutrient status to ensure the potato crop has no deficient or excess nutritional problems. The in-season monitoring is done with paired potato petiole and soil samples. The petiole and soil sampling starts about 30 days after emergence, then taken every week during the growing season.

A successful in-season potato monitoring program requires fast turnaround and reliable service on petiole and soil samples. This is where AGVISE Laboratories has excelled in serving the potato industry because we know the petiole and soil test results will be used immediately to make fertilizer and irrigation decisions on the fly. To make the data immediately available, the petiole and soil test results are posted online to the AGVISE website with next-day turnaround after the samples arrive at the laboratory.

It is also critical that the petiole and soil test results are easy to interpret and understandable to everyone on the agronomy staff. The AGVISE petiole and soil test report displays results in a graphic format, enabling agronomists to quickly evaluate plant nutrient levels and watch trends over the growing season. An example potato petiole and soil nutrient report is shown below. The report includes a weekly graph of petiole nitrate, phosphorus, and potassium alongside with soil ammonium- and nitrate-nitrogen.

For most irrigated potato producers, weekly potato petiole sampling is a given. But, an increasing number are also including soil samples for ammonium- and nitrate-nitrogen analysis each week. The soil nitrogen data is critical for timing an in-season nitrogen application. There are periods where very fast potato vegetative growth can cause unusually low petiole nitrate-nitrogen levels. The soil nitrogen data prevents overreaction to low petiole nitrate-nitrogen levels and avoids application of extra nitrogen, which could create potential tuber quality issues down the road.

AGVISE Laboratories has provided potato petiole and soil analysis services to the potato industry in the United States and Canada for over 40 years. In 2020, we analyzed over 12,000 potato petiole samples for potato growers at our Northwood, ND and Benson, MN laboratories. We know that timely information is important to our customers, and we are always making improvements to our service and support. If you have any questions, please talk with one of our agronomists or soil scientists about getting started with potato petiole analysis.

For potato petiole article

Fertilizing soybean

Soybean acres expanded greatly across the northern Great Plains and into Manitoba through the 1990s and 2000s. Today, soybean occupies a large portion of planted acres and makes a desirable rotation crop in canola, corn, and small grain production systems. As soybean has advanced northward and westward, soybean is often billed as a low maintenance crop, requiring no fertilizer or even seed inoculation. The fact is, if you expect soybean to be a low maintenance crop, you can expect low yield results. Achieving high soybean yields starts with a good, long-term soil fertility plan.

Nitrogen

Soybean yielding 40 bu/acre requires about 200 lb/acre nitrogen, but luckily you do not have to provide all the nitrogen! Soybean relies on nitrogen-fixing bacteria to meet its nitrogen requirements. Legumes, like soybean, form a symbiotic relationship with N-fixing bacteria, housed in root nodules, to provide sufficient nitrogen. Each legume species requires a unique N-fixing bacterium, thus an inoculant for lentil or pea does not work on soybean. Soybean seed must be inoculated with the N-fixing bacteria Bradyrhizobia japonicum. Ensure you have the proper soybean-specific seed inoculant. You can count the number of nodules on soybean roots and verify the presence of active N-fixing bacteria in the nodules with bright pink centers. These soybean plants have enough active N-fixing bacteria to meet soybean nitrogen requirements.

For new soybean growers, the N-fixing bacteria Bradyrhizobia japonicum is not naturally present in soil and seed inoculation is required. During the first few years of soybean establishment, supplemental nitrogen may be required to achieve good soybean yield while the N-fixing bacteria population builds. University of Minnesota researchers in the northern Red River Valley showed that soils with less than 75 lb/acre nitrate-N (0-24 inch) required 40-50 lb/acre additional preplant nitrogen. If successful inoculation and good nodule counts are observed in the first year, then no additional nitrogen should be required in subsequent years.

Plant soybean on soils with less than 100 lb/acre nitrate-N (0-24 inch), if possible. High residual soil nitrate may delay root nodulation with N-fixing bacteria and increase the severity of iron deficiency chlorosis (IDC). Because soybean can fix its own nitrogen, you may recoup better economic return on soils with high residual nitrate with crops that do not fix their own nitrogen like corn or wheat.

Phosphorus

Soybean does not respond to phosphorus as dramatically as grass crops like corn or wheat do. Nevertheless, medium to high soil test P are required to achieve good soybean yields. Soybean responds to broadcast P placement better than seed-placed or sideband P. In dryland regions where soybean is planted with air drills, seed-placed P or sideband P is often the only opportunity to apply phosphorus. You must pay special attention to seed-placed fertilizer safety with soybean. An air drill with narrow row spacing (6 inch) should not exceed 20 lb/acre P2O5 (40 lb/acre monoammonium phosphate, MAP, 11-52-0). Fertilizer rates exceeding the seed safety limit may delay seedling emergence and reduce plant population. For wider row spacings, no fertilizer should be placed with seed.

Potassium

Soybean removes far more potassium in harvested seed than canola or wheat. Soybean yielding 40 bu/acre removes about 60 lb/acre K2O, while wheat yielding 60 bu/acre removes only 20 lb/acre K2O. Pay close attention to potassium removal across the crop rotation. After soybean is added to the crop rotation, cumulative potassium removal greatly increases, and declining soil test K is observed over time.

Do not place potassium with soybean seed; delayed seedling emergence and reduced plant population can occur. Any potassium fertilizer should be broadcasted or banded away from seed.

Sulfur

Sulfur deficiency in soybean is uncommon, yet sometimes observed on coarse-textured soils with low organic matter (< 3.0%). Soybean response to sulfur is usually confined to certain zones within fields. With additional sulfur, soybean can produce more vegetative growth, but more vegetative growth may increase soybean disease severity, such as white mold. The residual sulfur remaining after sulfur-fertilized canola, corn, or small grain is often sufficient to meet soybean sulfur requirements.

Iron

Soybean is very susceptible to iron deficiency chlorosis (IDC). Soybean IDC is not caused by low soil iron but instead by soil conditions that decrease iron uptake by soybean roots. Soybean IDC risk and severity are primarily related to soil carbonate content (calcium carbonate equivalent, CCE) and worsened by salinity (electrical conductivity, EC).

Soybean IDC is common in the upper Midwest, northern Great Plains, and Canadian Prairies, where soils frequently have high carbonate and/or salinity. Within a field, IDC symptoms are usually confined to soybean IDC hotspots with high carbonate and salinity; however, symptoms may appear across a field if high carbonate and salinity are present throughout the field. Soybean IDC severity is made worse in cool, wet soils and soils with high residual nitrate. Soil pH is not a good indicator of soybean IDC risk because some high pH soils lack high carbonate and salinity, which are the two principal risk factors.

Guidelines for managing soybean IDC:

  1. Soil test each field, zone, or grid for soil carbonate and salinity. This may require soil sampling prior to soybean (possibly outside of your usual soil sampling rotation) or consulting previous soil sampling records.
  2. Plant soybean in fields with low carbonate and salinity (principal soybean IDC risk factors).
  3. Choose an IDC tolerant soybean variety on fields with moderate to high carbonate and salinity. This is your most practical option to reduce soybean IDC risk. Consult seed dealers, university soybean IDC ratings, and neighbor experiences when searching for IDC tolerant soybean varieties.
  4. Plant soybean in wider rows. Soybean IDC tends to be less severe in wide-row spacings (more plants per row, plants are closer together) than narrow-row spacings or solid-seeded spacings.
  5. Apply chelated iron fertilizer (e.g., high quality FeEDDHA) in-furrow at planting. In-furrow FeEDDHA application may not be enough to help an IDC susceptible variety in high IDC risk soils (see points #2 and #3).
  6. Avoid planting soybean on soils with very high IDC risk.

Zinc

Zinc deficiency in soybean is rare, even on soils with low soil test Zn. Soybean seed yield response to zinc is limited on soils with less than 0.5 ppm Zn. More zinc sensitive crops like corn, dry bean, flax, and potato will respond to zinc on soils with less than 1.0 ppm Zn. If zinc sensitive crops also exist in the crop rotation, you may apply zinc with broadcast phosphorus or potassium during the soybean year as another opportunity to build soil test Zn across the crop rotation.

Copper for Small Grains

Among crops grown in the northern Great Plains, small grains (cereals) are the most susceptible to copper deficiency. Copper (Cu) is an essential micronutrient required in small concentrations for plant growth and reproduction. Copper deficiency symptoms in cereals include pale yellowing, wilted and twisted leaf tips, and malformed seed heads. Severe copper deficiency will stop plant growth and kill plants during tiller formation. During pollination, copper deficiency will cause florets to remain partially open. This creates a vulnerable period for diseases, such as Fusarium head blight (head scab) and ergot, to infect the seed head and reduce grain yield.

Small grains sensitive to copper deficiency include barley, oat, rye, triticale, and wheat (including durum, spring, and winter types). Copper deficiency is most common on soils with less than 0.5 ppm Cu. Soils with low soil test Cu frequently include sandy soils with low organic matter (<3.0%) and organic soils (peat) with very high organic matter (>10%). Between soil and plant analysis, diagnosing copper deficiency with soil analysis is the most predictive. Plant analysis is less helpful because the plant Cu concentrations in sufficient and deficient plants are very close.

The most effective strategy to build soil test Cu on mineral soils is to broadcast-incorporate copper sulfate (25% Cu). building soil test Cu for many years. Do not mix copper sulfate with seed-placed dry fertilizer blends for air drills; copper sulfate is a hygroscopic (water holding) material that makes blending difficult and bridging is a concern. For seed-placed copper, use a liquid copper source injected in furrow. Liquid copper sources include dissolved copper sulfate and various chelated Cu products.

On organic soils, soil test Cu is difficult to build as copper readily forms complexes with soil organic matter. To reduce copper complexation, apply seed-placed liquid copper at planting and follow with foliar copper in the first herbicide application. Liquid copper sources include dissolved copper sulfate and various chelated Cu products.

Caution: Ammonium Sulfate with Seed

Seed-placed fertilizer is a common practice to increase seedling vigor and optimize fertilizer placement and crop response. This is a popular strategy to apply phosphorus for canola, corn, and wheat. However, the seed-placed fertilizer rate cannot exceed seed safety limits, otherwise seedling germination and plant population may be reduced. Sulfur is very important in canola growth and development, so farmers often try placing ammonium sulfate (AMS) with canola seed as well! This can create big problems.

A team of agronomists and soil scientists at the University of Manitoba conducted greenhouse and field studies, examining the effect of seed-placed ammonium sulfate on canola plant population and seed yield. The plant population loss was much greater on soils with pH > 7.5 (Figure 1). The high pH soils contained calcium carbonate (CaCO3), which reacts with ammonium sulfate to create calcium sulfate (gypsum) and ammonium carbonate. The higher reaction pH of ammonium carbonate produces free ammonia (NH3). Free ammonia (NH3) in soil is toxic to living organisms and kills germinating seeds. Acute ammonia toxicity is a major concern with fertilizer materials that liberate free ammonia (NH3) in soil, such as anhydrous ammonia (82-0-0) or urea (46-0-0), ultimately reducing plant population if you are not careful with fertilizer rate and placement.

For Caution: Ammonium Sulfate with Seed post

Figure 1. Ammonium sulfate (AMS, 21-0-0-24S) included with seed-placed monoammonium phosphate (MAP, 10-52-0) reduced canola plant population. Soil carbonate content is 21% CCE and 0.5% CCE in knoll soil and hollow soil, respectively. Brandon, Manitoba.

Across the landscape, soil pH and carbonate content will vary. The well-drained lower landscape positions (swales, hollows) often have acidic to neutral pH and little carbonate. The upper landscape positions (knobs, knolls), suffering decades of soil erosion, often have high pH and ample carbonate (Figure 1). The risk of plant population loss is greater on eroded knobs where adding ammonium sulfate can create ammonia toxicity concern.

Considerable yield loss will occur if canola plant population is less than 70 plants per square meter. Even with low fertilizer rates, the interaction of seed-placed ammonium sulfate and phosphorus can greatly reduce canola plant population. In Manitoba, 25% plant population loss was observed with only 8 lb/acre S and 18 lb/acre P2O5 (Figure 2).For Caution: Ammonium Sulfate with Seed article

Figure 2. Ammonium sulfate (AMS, 21-0-0-24S) included with seed-placed monoammonium phosphate (MAP, 10-52-0) reduced canola plant population. Carman, Manitoba, 2011.

Sulfur is vital for successful canola production, but it must be applied safely. There are new air drill configurations with innovative seed and fertilizer placement options. Seed safety is paramount with seed-placed fertilizer. Ammonium sulfate should be broadcasted or banded away from seed (mid-row). Keeping ammonium sulfate away from seed will also allow you to maximize seed-placed phosphorus rates and efficiency without jeopardizing seed safety.

Placing ammonium sulfate with seed should be an emergency option only. Canola plant population loss should be expected, even at low ammonium sulfate rates, on soils with pH greater than 7.5 and calcium carbonate.

Soybean Iron Deficiency Chlorosis: Symptoms, Causes, and Management


Figure 1. Soybean plants with iron deficiency chlorosis symptoms. Note the newest leaves are yellow with indistinct green veins.

If soybean turns yellow during an early growth stage, you may have a case of soybean iron deficiency chlorosis (IDC). The distinctive yellow symptoms of soybean IDC often appear as soybean enters the first- to third-trifoliate leaf stage. Soybean IDC is characterized by distinct interveinal chlorosis (yellow leaf with green leaf veins) in the newest leaves and may result in substantial yield loss (Figure 1). Soybean IDC is not caused by low soil iron but instead caused by soil conditions that decrease iron uptake by soybean roots.

Soybean IDC risk and severity are primarily related to soil carbonate content (calcium carbonate equivalent, CCE) and worsened by salinity (electrical conductivity, EC) (Table 1). Soybean IDC is common in soybean-growing regions of the upper Midwest, northern Great Plains, and Canadian Prairies, where soils frequently have high carbonate and/or salinity (Figure 2). Within a field, IDC symptoms are usually confined to soybean IDC hotspots with high carbonate and salinity; however, symptoms may appear across a field if high carbonate and salinity are present throughout the field. Soybean IDC severity is made worse in cool, wet soils and soils with high residual nitrate-nitrogen. Soil pH is not a good indicator of soybean IDC risk because some high pH soils lack high carbonate and salinity, which are the two principal risk factors.

Table 1. Soybean iron deficiency chlorosis risk (IDC) risk potential based on soil carbonate content and salinity.
Calcium carbonate equivalent (CCE)
Salinity (EC 1:1), dS/m less than 2.5% 2.6 – 5.0% greater than 5%
less than 0.25 low low moderate
0.26 – 0.50 low moderate high
0.51 – 1.00 moderate high very high
greater than 1.00 very high very high extreme

Figure 2. Soil samples with high risk of soybean iron deficiency chlorosis (IDC) in the northern Great Plains and upper Midwest.

Unlike a nitrogen or sulfur deficiency, soybean IDC is not correctable with an in-season fertilizer application. Foliar application of iron fertilizers, including FeEDDHA, may have short-term cosmetic effects, but foliar iron applications have not consistently increased soybean yield on IDC-affected plants. Chlorosis symptoms often alleviate naturally as environmental conditions improve (e.g. drier, warmer weather), but severe cases can persist and cause yield loss. North Dakota State University research has shown that IDC persisting into the fifth- and sixth-trifoliate leaf stage will significantly reduce soybean yield. For fields with historical soybean IDC problems, you should delineate soybean IDC hotspots for selective management using aerial or satellite imagery.

Guidelines for managing soybean IDC

  1. Soil test each field, zone, or grid for soil carbonate and salinity to evaluate soybean IDC risk potential (Table 1). This may require soil sampling prior to soybean (possibly outside of your usual soil sampling rotation) or consulting previous soil sampling records.
  2. Plant soybean in fields with low carbonate and salinity (principal soybean IDC risk factors).
  3. Choose an IDC tolerant soybean variety on fields with moderate to low carbonate and salinity.
  4. Plant soybean in wider rows. Soybean IDC tends to be less severe in wide-row spacings (plants are closer together) than narrow-row spacings or solid-seeded spacings.
  5. Apply chelated iron fertilizer (e.g., high quality FeEDDHA) in-furrow at planting. In-furrow FeEDDHA application may not be enough to help an IDC susceptible variety in high IDC risk soils (Figure 3).
  6. Avoid planting soybean on soils with very high IDC risk.

Figure 3. Soybean iron deficiency chlorosis (IDC) severity is reduced with iron fertilization. However, IDC-tolerant soybean varieties are more effective. Research from Dr. R. Jay Goos, NDSU, 2000.