Controlling Soybean Cyst Nematode: Do you have a resistance problem?

This article originally appeared in the AGVISE Laboratories Winter 2022 Newsletter

This is the third year of our soybean cyst nematode (SCN) resistance project. Each year, we have flagged spots in soybean fields and collected paired SCN soil samples in June and September. If the SCN egg count increases through summer and into fall, we can quickly learn if the soybean SCN-resistance source, either PI88788 or Peking, is working or failing. University SCN surveys have found that the PI88788 resistance source has begun to lose its effectiveness at controlling SCN populations in much of Minnesota. This is a particular problem because 95% of SCN-resistant soybean varieties still use the PI88788 resistance source.

SCN egg count and soybean yield data from the 2021 AGVISE SCN resistance project. Bars of the graph represent SCN egg count, lines of the graph represent soybean yield. Click on the graph for a higher resolution version.

In 2021, paired soybean variety comparisons with SCN soil samples and soybean yield data really helped us see the difference in these SCN resistance sources. Among the sites, the Peking resistance source always had a lower SCN egg count than the PI88788 comparison, indicating that the Peking soybean varieties had better control of the SCN population at 4 of 5 sites. The Alberta site had similar SCN population control with both PI88788 and Peking resistance sources, so the soybean yield was similar at the site. However, the other sites demonstrated SCN resistance to PI88788, and the resulting soybean yield with the Peking resistance source was better with 7-bu/acre soybean yield increase on average.

For 4 of 5 sites, it is apparent that a Peking-traited soybean variety is the better choice. To learn if you have SCN resistance problems in your field, the simple early-late SCN soil sampling exercise, like we did in this project, is a quick way to learn if your current soybean variety is still controlling SCN and delivering the best soybean yield.


How much residual soil nitrate is left after the 2021 corn crop?

It’s probably more than you think.

So far, the residual soil nitrate-nitrogen trend following corn is much higher than average across the upper Midwest and northern Great Plains. This follows the same trend set by the 2021 wheat crop. For many growers in the region, the hot and dry growing season has resulted in high residual soil nitrate-N carryover where corn yield was lower than average. An update on average residual soil nitrate-N after grain and silage corn, broken into zip code areas, can be found below (Table 1). This data highlights the importance of soil sampling for nitrate-N, even after high N-requirement crops you may not think of leaving much residual soil nitrate-N behind.

Bar graph showing median residual nitrate-N in lb/acre for fields sampled after grain corn as of Oct. 11, 2021. Results include fields tested in MN, ND, SD, and MB. Fields tested thus far are on pace to set a record for amount of nitrate-N left after corn.

The early soil nitrate-N trend data gives us a snapshot of the soil samples that AGVISE has analyzed so far. The average soil test data is not a replacement for actual soil test results on your fields or your clients’ fields. There is considerable variability within a single zip code area, with some corn fields having less than 20 lb/acre nitrate-N and many other fields that are much higher. Take a look at eastern South Dakota, the Sioux Falls and Watertown areas have over 49% of soil samples with more than 100 lb/acre nitrate-N (0-24 inch soil depth). Considering sky-high nitrogen fertilizer prices (and still rising), it makes sense to soil test for nitrate-N and credit it toward next year’s crop nitrogen budget.

Agronomic considerations for soybean in 2022

One crop that will not benefit from extra residual soil nitrate-N after corn is soybean. Soybean can create its own nitrogen thanks to a symbiotic relationship with nitrogen-fixing bacteria. The nitrogen fixation process takes energy, however, and if there is already ample plant-available nitrate in the soil, soybean will delay nodulation and take advantage of the free nitrate. Delayed nodulation may ultimately lead to soybean yield loss.

High residual soil nitrate-N can also increase soybean iron deficiency chlorosis (IDC) severity.  Soybean IDC is a challenge for growers in the upper Midwest, northern Great Plains, and Canadian Prairies, especially on soils with high carbonate and salinity. If soil nitrate-N is also high, research has shown it can make soybean IDC even worse and result in lower soybean yield. If you plan to grow soybean on fields with high residual soil nitrate-N, seriously consider IDC-tolerant soybean varieties or consider planting them on fields with lower residual soil nitrate-N.

Should a corn-corn rotation be considered after a drought year and high soil nitrate?

Planting a second corn crop would allow a producer to capture this “free” nitrate-N in the soil profile. However, planting corn on corn has many challenges from soil moisture to insect pressures (e.g. corn rootworm). The 2021 corn crop started the growing season with a full profile of water (due to excessive moisture in 2019 and adequate moisture in 2020) and ended with enough to push the corn crop through harvest. Going into the 2022 growing season, plant available water will be considerably less than the beginning of 2021. If the drought continues into 2022, remember that corn requires more moisture than soybean, so planting corn on corn means putting a higher water-requiring crop on ground that had less water to start with (versus corn following soybeans). Less available moisture, combined with other agronomic pressures, may mean less than expected yield for a corn-on-corn rotation.

Table 1. Residual nitrate trends as of Oct. 11, 2021 from more than 2,500 soil samples taken after corn. Regions with less than 60 soil samples are not included in the table.

Corn Stalk Nitrate Test

To help evaluate nitrogen management in corn, you may want to try the corn stalk nitrate test as a post-mortem tool. The corn stalk nitrate test is a late-season or end-of-season plant analysis on mature corn stalks. Iowa State University developed the corn stalk sampling protocol and interpretation. If corn did not have sufficient nitrogen, the corn stalk nitrate level will be low. If corn had excess nitrogen, the corn stalk nitrate level will be high.

The corn stalk nitrate test can be useful in cropping systems with manure or corn-after-alfalfa, where a significant portion of the crop nitrogen budget comes from nitrogen mineralization. It is also helpful in more humid climates, where the residual soil nitrate-nitrogen test is not utilized. For corn silage production, it is easy to collect corn stalk samples on the go during silage harvest, making it a quick and useful tool.

Since the corn stalk nitrate test is a post-mortem tool with the goal to provide information for future years, it is not recommended in years with abnormal precipitation. In drought years, potential crop productivity is reduced, so the plant nitrogen requirement is lower than normal. In high precipitation years, soil nitrogen losses will reduce the available nitrogen supply. As a result, the corn stalk nitrate level can be very high in drought years or very low in wet years. Such results say more about environmental conditions, not the adequacy of the nitrogen fertilizer program.

When to sample

  • Early: One-quarter milk line (R5 growth stage) on majority of corn kernels. Nitrate concentration may be high if collected early.
  • Optimum: One to three weeks after physiological maturity (black layer, R6 growth stage) on 80% of corn kernels.
  • Late: Up to harvest. Nitrate concentration may be low if rainfall has leached nitrate from plant material.

How to sample

  • Measure 6 inches from the ground, cut the next 8 inches of corn stalk (the 6-14 inch stalk section measured from plant base). Remove outside leaf sheath.
  • Collect 12 to 15 corn stalks.
  • Place corn stalks in a ventilated plant tissue bag. Do not use plastic or zipped bag.
  • Do not collect diseased or damaged corn stalks.

Table 1. Corn Stalk Nitrate Test Interpretation

Nitrate-N (NO3-N), ppm Interpretation Comment
<250 Low Nitrogen supply was likely deficient and limited corn grain yield
250-2000 Sufficient
>2000 High Nitrogen supply exceeded plant requirement
for corn stalk nitrate test article

Corn stalk sampling instructions for end-of-season corn stalk nitrate test (from Iowa State Univ. Ext. Circ. CROP 3154, 2018).

Soil Nitrogen Trends – Fall 2021; High Variability Following Drought

This article was originally published following the 2021 drought.

The 2022 growing season may seem like a long way off, but spring will be here before we know it. In fact, many growers are already making (or have made) crop choices and seed variety decisions for 2022. One factor that must be considered when making crop and variety selections for 2022 is residual soil nitrate-nitrogen following the 2021 growing season. For many in the northern Great Plains and Canadian Prairies, the 2021 growing season was hot and dry, which resulted in high residual soil nitrate levels following many crops. An update on average residual nitrate levels after wheat, broken down by geography, is below (Table 1). Residual soil nitrate-nitrogen following other crops, including soybean, are also higher than average (Table 2). This highlights the importance of soil sampling, even after crops we do not typically think of leaving high residual soil nitrate behind.

The data in the tables represents a snapshot of the samples we have tested so far this fall. While the average residual soil nitrate-nitrogen for an area may be interesting to talk about, it is not a replacement for actual soil test results from you or your growers’ fields. The data shows that over 30% of the wheat fields in many areas (see the right-hand column of the table) test over 100 lb/acre soil nitrate (0-24 inch depth). Droughts like 1988 and 2021 are very uncommon and leave us in situations that we are not used to dealing with. Using an average soil nitrate level from a region to decide an N rate on an individual field would be like deciding to apply an insecticide on every acre of the farm without even looking at each field to see if the insect is present. You need actual soil test data on each field to make informed decisions.

Table 1. Residual nitrate trends as of Sept. 17, 2021 from more than 20,000 soil samples taken after wheat. Regions with less than 100 soil samples are not included in the table.

Table 2. Residual nitrate trends as of Sept. 17, 2021 for crops other than wheat. Regions with less than 100 soil samples for each respective crop are not included in the table.

High Fertilizer Prices

According to the September 15, 2021 DTN fertilizer price survey, retail fertilizer prices continue to rise. The average price per pound of nitrogen by fertilizer product is $0.61/lb N for urea, $0.46 lb/N for anhydrous ammonia, and $0.66/lb N for UAN-28. This represents a 55%, 73%, and 71% increase in price compared to prices for the same fertilizers this time last year. Long story short, fertilizer is expensive. High residual soil nitrate following wheat may help reduce input costs in 2022, as long as you know what the residual soil nitrate in your fields is and take advantage of it by growing a crop that requires nitrogen fertilizer. If you have a soil nitrate test of 80 lb/acre (0-24 inch) after wheat, that is about 50 lb more than normal carry over. The extra 50 lb/acre soil nitrate is worth $30.00/acre (based on the current urea price).

Sampling Fields for Soybean Cyst Nematode (SCN)

Soybean cyst nematode (SCN) is a microscopic parasitic worm that attacks the roots of susceptible soybean and dry edible bean, causing unseen or unexplained yield losses. Soybean and dry edible bean are naturally susceptible to SCN, but through plant breeding, most soybeans have some level of resistance, varying in level from good to poor. The most common source of resistance to SCN in soybean is PI88788, which is about 30 years old, and many soybean growing areas have SCN populations that are becoming resistant to this source. The Peking source is a very effective SCN resistance source but is only available in less than 5% of all soybean varieties.

Soybean cyst nematode cysts each harbor hundreds of eggs. Cysts and eggs of SCN can survive in the soil and remain viable for many years even without a soybean or dry bean host. Any activity that moves soil around will move SCN, meaning that areas with a history of soybean production likely have or will have this pest. Soybean cyst nematodes were first reported in Minnesota in 1978, South Dakota in 1995, North Dakota in 2003, and Manitoba in 2019.

During the growing season, the developing SCN cysts containing the eggs can be seen on susceptible plant roots, as seen in the picture below. To get an accurate assessment of the infestation level of the field, you need to collect soil samples and submit them to a laboratory to get a measure of the SCN egg count.

Photograph of soybean roots with SCN cysts. Photo courtesy of NDSU.

Sampling strategies

If you have never tested for SCN before, you will want to sample fields intended for soybean or dry bean for the presence of SCN and gather a baseline SCN egg count. The best time to collect this sample is at the end of the growing season, right before harvest or just after (before any tillage). Sampling in the fall coincides with the highest egg levels in the soil and typically falls in the months of September and October. Collect 10-20 soil cores (6 to 8 inch soil depth) right in the soybean row from areas of the field that are likely to have SCN. Since SCN is a soil-borne pathogen, it moves wherever contaminated soil can enter the field. Therefore, the areas you will want to collect samples from are field entry points where soil can be transferred on equipment and tires, places where blown soil accumulates (e.g., fence lines), ditches and flooded areas, and locations in fields with consistently low soybean yields. Mix the soil cores together and take a subsample to fill a soil sample bag.

If you know you have SCN, you will want to sample soybean fields twice during the year: once in June to get an initial SCN egg count and then again in the fall to get a final SCN egg count. The early and late SCN samples allow you to measure if SCN populations are being effectively controlled (i.e., no increase in SCN egg count) or if the soybean variety SCN resistance source is failing (i.e., SCN egg count increases). Choose a single point in the soybean field and collect 8-10 soil cores (6 to 8 inch soil depth) taken within the soybean row at that spot. Mix the cores together and fill a regular paper soil sample bag. Mark that point with a flag and collect its GPS coordinates. Come back to that exact spot in the fall and collect a second sample. This will help you assess how your SCN management strategies, including the soybean variety SCN resistance source and soybean seed treatment, are working in the field.

Preparing and sending SCN samples to AGVISE Laboratories

You can submit SCN samples via paper submission form or online in the AGVISOR portal. AGVISE provides special paper submission forms for SCN samples (bright yellow sticker) at no charge. The bright yellow forms and stickers help us sort samples and ensure samples submitted for SCN analysis are not dried and ground. All SCN samples analyzed by AGVISE Laboratories are analyzed at the Benson, MN laboratory. You can send the SCN samples directly to the Benson location, or to the Northwood location, where we will route the SCN samples to Benson for analysis. AGVISE Laboratories reports SCN results in “eggs/100 cc” of soil and provides interpretation on our reports informed by university research.

Helpful links:

Soybean Cyst Nematode Resource Compendium, Iowa State University

Soybean Cyst Nematode (SCN) Management, Univ. Minnesota

Soybean Cyst Nematode, NDSU

Soybean Cyst  Nematode in South Dakota: History, Biology, and Management, SDSU

The SCN Coalition Website

Feed Nitrate Testing in Drought Years: How to Collect Corn Samples

This article was originally published during the 2021 drought.

Drought continues to stress crops across the upper Midwest and the Canadian Prairies. As crop conditions continue to deteriorate in some places, we have received more phone calls about salvaging the drought-stressed crop as livestock feed and the need for feed nitrate testing. As you consider what to do with your standing crop, whether to harvest for grain or cut for hay, an important part of that consideration will be the nitrate concentration of the crop.

When drought-stressed annual crops (e.g., wheat, barley, oat, corn) are cut or grazed, producers must exercise caution about livestock nitrate poisoning when feeding these forages. Drought-stressed crops often accumulate nitrate because plant uptake of nitrate exceeds plant growth and nitrogen utilization. Nitrate is usually concentrated in lower plant parts (lower stem or stalk). When livestock, particularly sheep and cattle, ingest forages with a high nitrate concentration, nitrate poisoning can occur.

Instructions for collecting and submitting a feed nitrate test

1. Collect the plant part that livestock will consume, which may be the whole aboveground plant. If grazing, be mindful of the grazing height because the plant nitrate concentration will be lower near the base of the plant. If baling for hay or chopping for silage, cut at the intended cutter bar height.

Picture used for feed nitrate email - corn collage

2. Cut plant material with sturdy garden shears into 1- to 2-inch pieces. Mix the chopped plant parts together and take one quart-sized subsample for analysis (about four good handfuls).

3. Place subsample in AGVISE Plant Sample Bag. Write “Feed Nitrate” as the crop choice and select “Nitrate-nitrogen” as the analysis option.

    • If you are considering chopping corn for silage, also write “%Moisture” as an additional analysis because you will need to know if the moisture content is still adequate for silage fermentation. You may be surprised how much water will still be in drought-stressed corn stalks.

4. Ship plant sample to AGVISE Laboratories. If you cannot ship the sample right away, store it in a refrigerator until you can ship it.

IMPORTANT: Resample the hay or silage before feeding to any livestock. You need to know what is actually being fed to livestock, and you may need to blend it with other feed sources to dilute the nitrate concentration. For dry hay in bales, the nitrate concentration will not change in storage; use a hay probe to obtain the best possible feed sample. For silage, the nitrate concentration may decrease 20 to 50% during fermentation, so a fresh sample is necessary before feeding.

IMPORTANT: Many crop protection products have grazing restrictions on their labels that dictate if or when a crop treated with a product can be fed to livestock. Before using or selling a crop for livestock feed, check all labels of crop protection products that have been used on the crop this season. This includes seed treatments, herbicide applications, fungicide applications, and insecticide applications.

AGVISE Laboratories offers next-day turnaround for feed nitrate analysis. Rapid turnaround on nitrate analysis is important for producers debating to cut and bale or graze small grains or corn as livestock feed.  We also provide livestock water analysis, which includes total dissolved solids, nitrate, and sulfate, to assess livestock drinking water quality. Please call AGVISE staff in Northwood, ND (701-587- 6010) or Benson, MN (320-843-4109) with questions about nitrate, feed and hay quality, or water analysis. We can send you sampling supplies if needed.

AGVISE Laboratories Online Supplies Store

Helpful resources on using drought-stressed crops for livestock feed:

Nitrate Poisoning of Livestock (NDSU)

Using Drought-Stressed Corn as Forage (SDSU)

Drought-Related Issues in Forage, Silage and Baleage (Univ. of Missouri)

Potassium and Drought: A Two-fold Water Uptake Problem

Potassium is back on the radar for many farmers and agronomists across the upper Midwest and northern Great Plains. In the past two weeks, corn growth and development have reached the stage where potassium deficiencies are becoming quite apparent, and widespread dry soil conditions during the 2021 drought have worsened the problem. In some instances, corn is displaying potassium deficiency symptoms on soils with medium to high soil test K (120 to 180 ppm) in spite of potassium fertilizer application.

Potassium is required in large quantities for plant growth and development. The plant tissue K range in normal corn plants is 3-5% K, which is similar to nitrogen. A 200-bushel/acre corn crop will typically uptake 200 lb N, 108 lb P2O5, and 280 lb K2O per acre through the growing season (IPNI, 2014). In other words, an actively growing corn crop takes a lot of potassium! Luckily, you do not have to apply all that potassium as fertilizer, and much will come from the plant-available K pool in the soil.

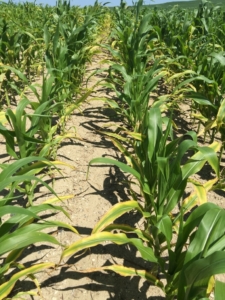
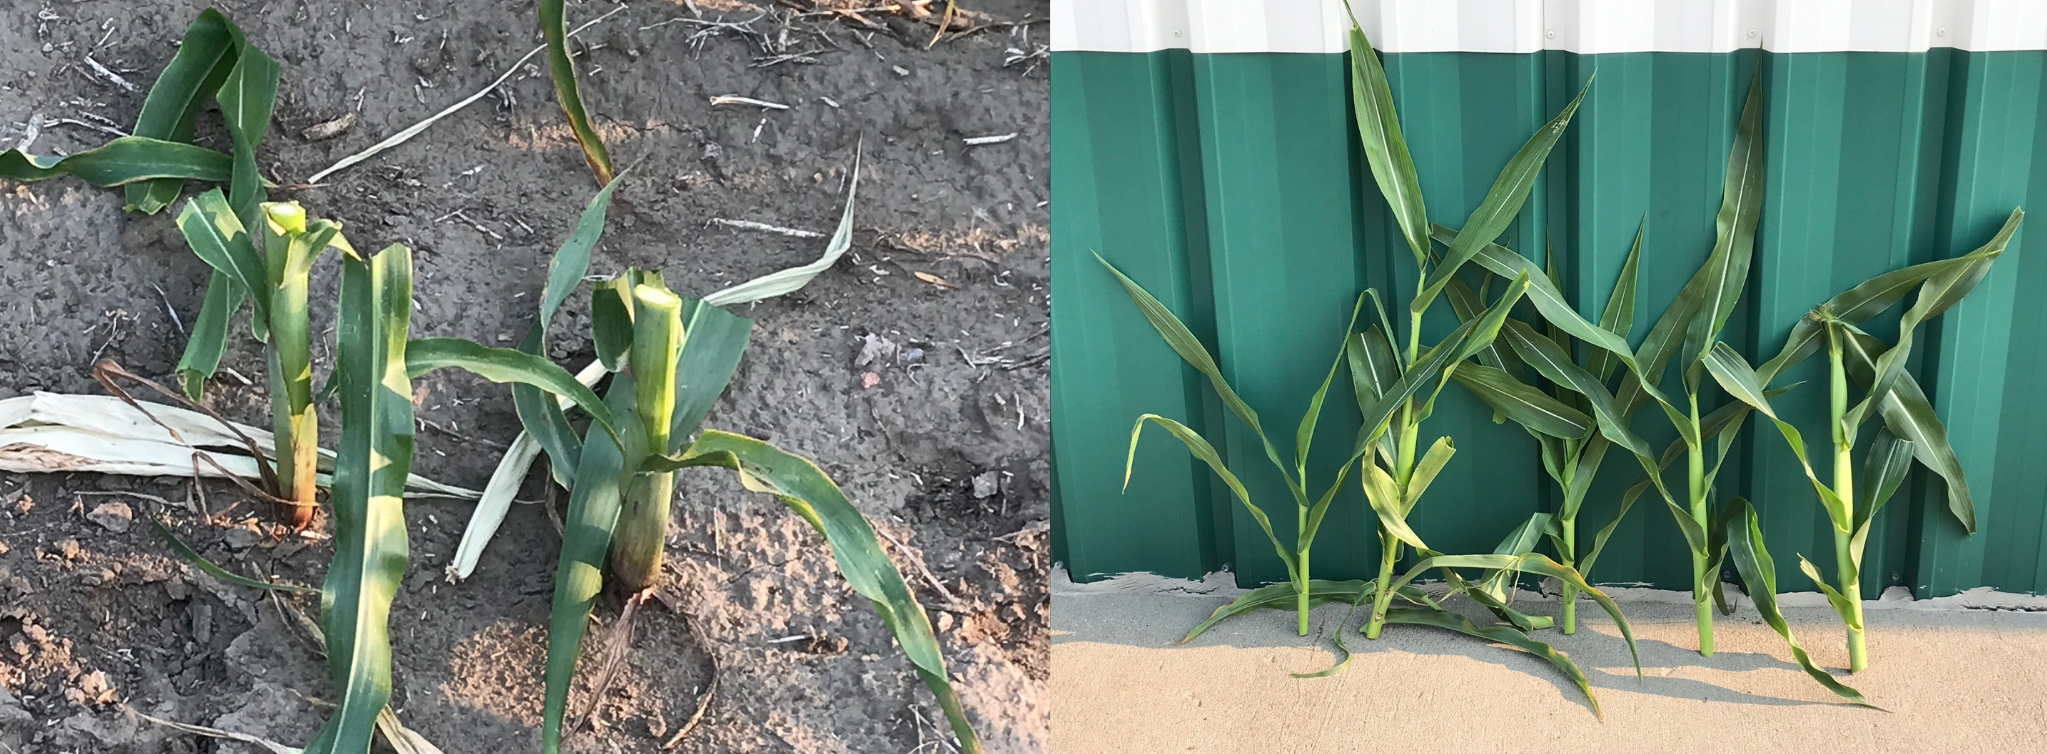
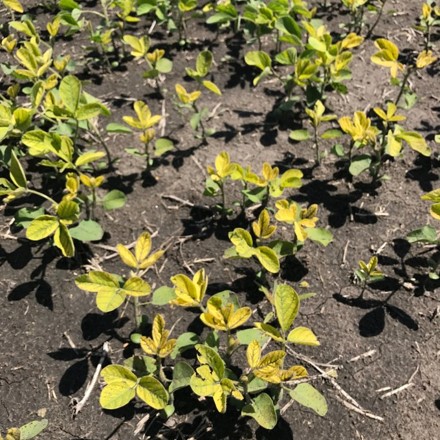
Potassium deficiency in corn. Symptoms are leaf chlorosis (yellowing) and necrosis (death) beginning at the leaf tip and outer leaf margin and progressing toward the midrib, often with wavy leaf edges. Potassium is mobile in the plant, so symptoms appear on the lower leaves first as the plant remobilizes potassium from lower leaves to support new plant growth. 

Drought reduces potassium availability

The plant-available K pool becomes less available when soil water is limited. This has become the top story as the 2021 drought has continued. Plant roots acquire potassium mostly through a process called diffusion. Diffusion is the slow movement of ions through water around soil particles to the plant root for uptake. As soil becomes drier, the thickness of the water film around soil particles becomes thinner and thinner, thus the diffusion path for potassium ions becomes longer and longer. The soil pore space becomes mostly air with little water remaining. This ultimately slows the rate at which potassium from soil or fertilizer can reach the plant root, and potassium deficiency may occur.

The consequence of the drought-induced potassium deficiency is two-fold because potassium also plays an essential role in plant water regulation. Potassium-stressed plants experience reduced photosynthesis and transpiration rates, resulting in poor water use efficiency of the already limited soil water that is available. In a nutshell, low soil water content reduces potassium availability from soil and fertilizer, and then the soil water that is there is poorly utilized because of the lack of potassium. In addition to limited soil water, other factors compound to reduce potassium uptake: soil test K, soil texture, clay mineralogy, soil compaction, and even fluffy soil syndrome.

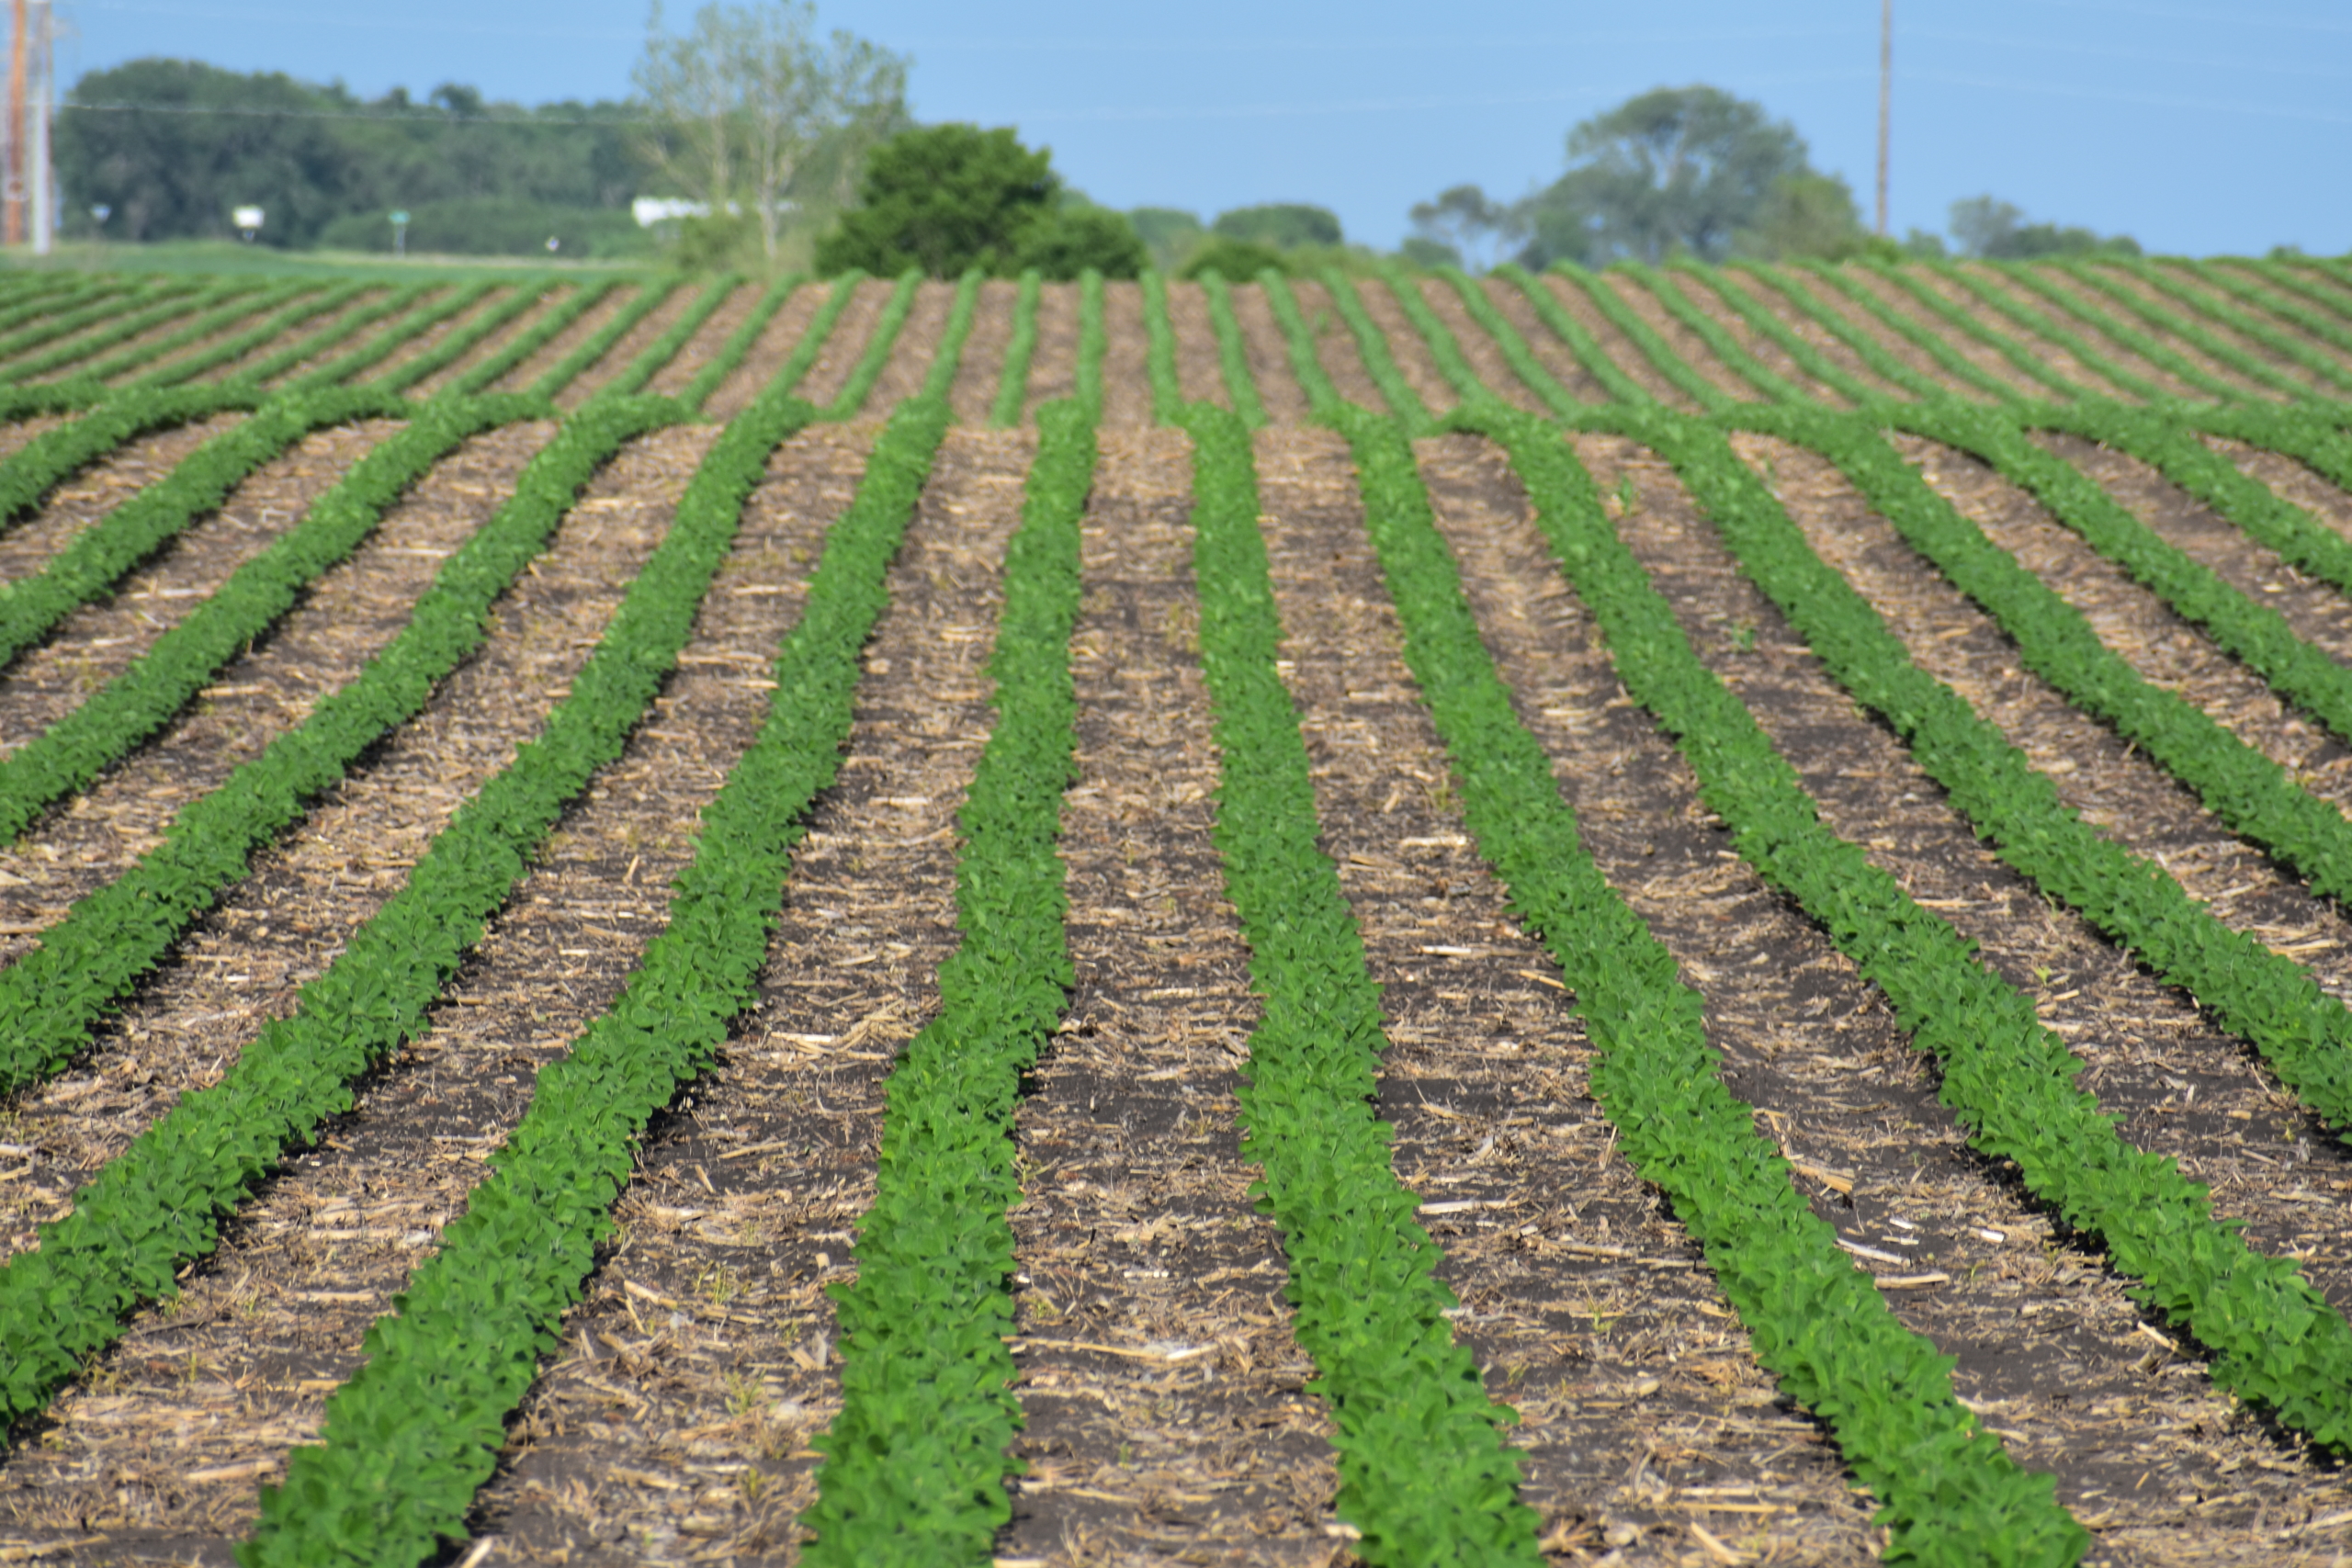
Believe it or not, fluffy soil syndrome has been a component of more than one phone call concerning potassium deficiency. Do you see greener plants near the planter wheel tracks or sprayer tracks? Fluffy soil syndrome occurs when soil has not completely settled since spring tillage, which results in poor soil particle-to-particle contact and slow soil-water-root diffusion routes for potassium ions. The wheel tracks adequately firmed the soil to provide good soil particle-to-particle contact, maintaining better potassium diffusion.

Potassium deficiency in corn: A case study

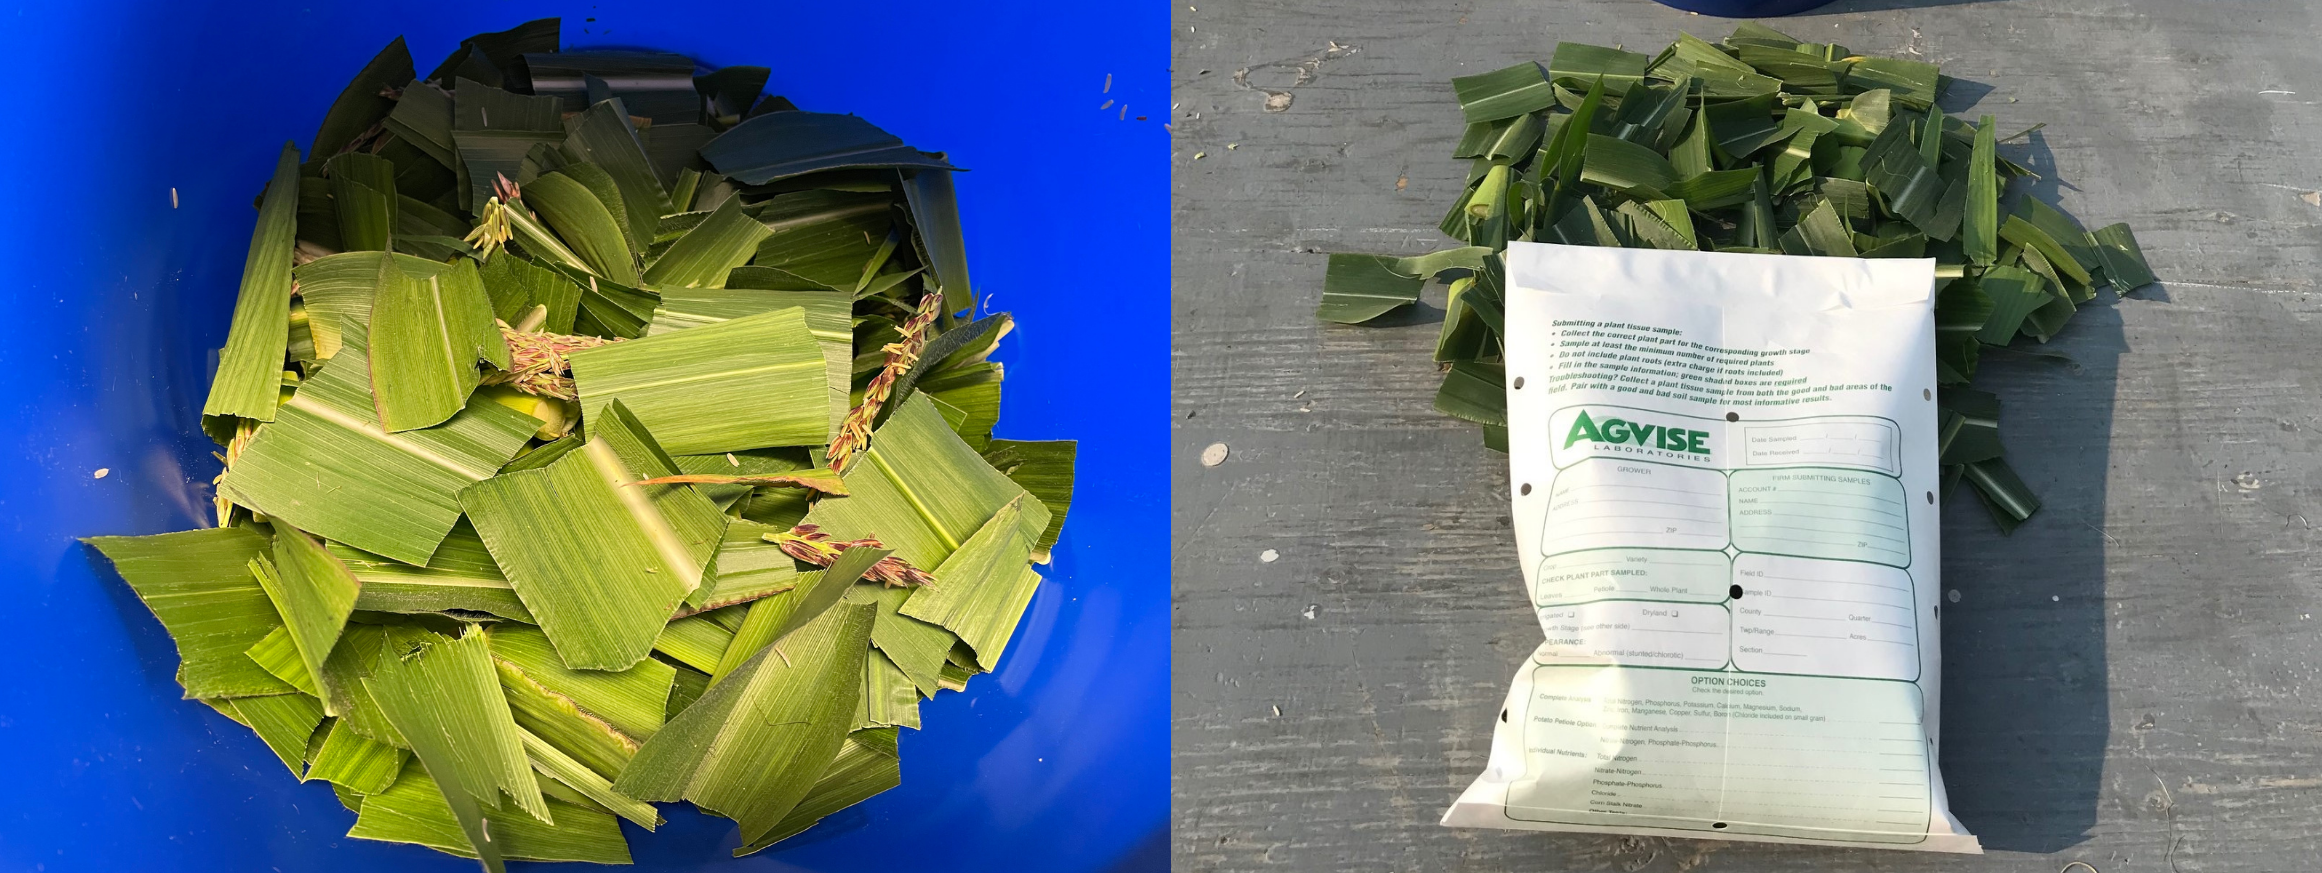
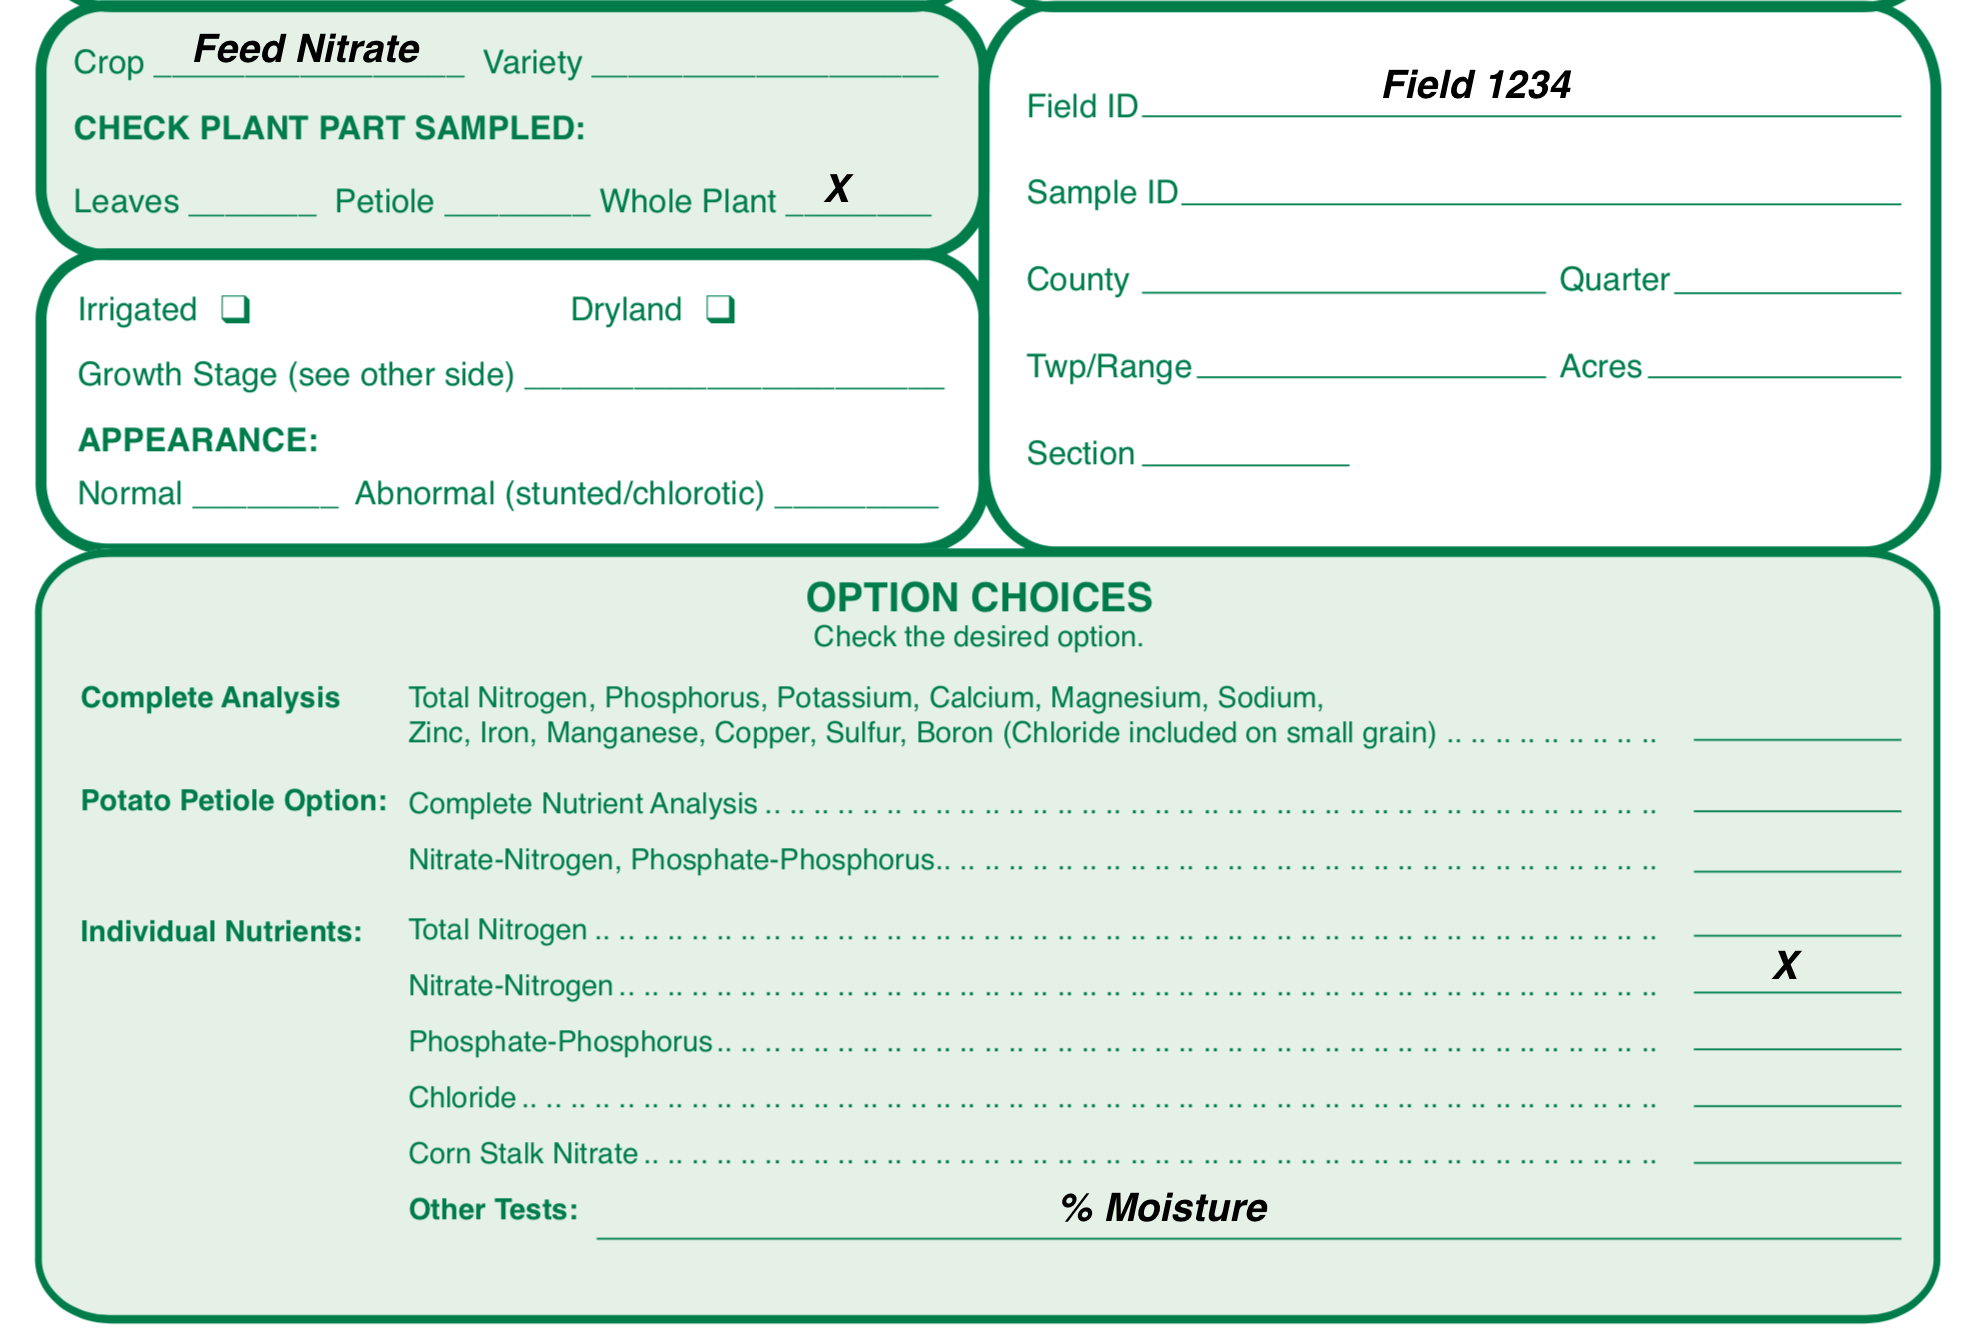
In June 2021, AGVISE started to receive plant and soil samples to diagnose suspected potassium deficiencies in various crops. This corn example from west central Minnesota included plant and soil samples collected in the good and poor areas of the field. The leaf K concentration was 0.59% in the good and 0.52% in the poor area. For comparison, the corn leaf K sufficiency range at this growth sage should be 2-3% K. The corresponding soil samples had soil test K at 148 ppm in the good and 140 ppm in the poor area. The soil test K critical level for corn is 150-200 ppm, and the farmer had applied 50 lb/acre K2O broadcast + incorporation, which is very close to the university sufficiency guideline for corn. Although the farmer more or less did everything right for a normal rainfall year, drought conditions have reduced potassium availability to the point where potassium deficiency symptoms were apparent and visible.

One week after the plant and soil samples were collected, the field received an inch of rain, and the potassium deficiency symptoms disappeared! The entire corn field is green now. It is amazing what a little water will fix.

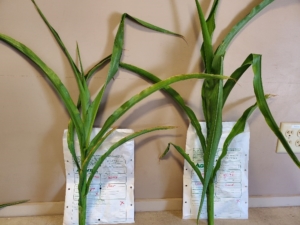
Potassium deficiency in corn confirmed with plant and soil analysis. Potassium-deficient corn plant (left) displays chlorosis and necrosis of the outer leaf margin and wavy leaf edge. Plant and soil samples were collected June 2021 in west central Minnesota.

Correcting the problem

So, what do you do next? Do you try to apply an in-season rescue potassium fertilizer application? You still need rain to water in any fertilizer applied to the soil surface. If you had applied an adequate amount of potassium fertilizer before planting, then the appropriate decision is to wait for rain to improve soil and fertilizer potassium availability. However, some people may not have applied enough potassium initially. In these cases, a rescue application of 60 lb/acre K2O broadcast (100 lb/acre potash, 0-0-60) followed by some rain should correct the symptoms. Do not skimp with anything less because you are already behind the eight-ball and you will need that much material to cover the soil surface adequately and affect enough individual corn plants. In NDSU research (2014-2016), an uncorrected potassium deficiency in corn could cost 20-30 bushel/acre compared to corn receiving adequate potassium fertilizer.

For liquid materials, potassium acetate and potassium thiosulfate could be dribbled between the rows, but the potassium rate will need to be similar to the dry potassium fertilizer rate and cost will likely be greater. Remember, potassium is something required in large quantities, not something corrected with a small application of 5-10 lb/acre K2O.

There is no way we could have planned for the very dry conditions that are exacerbating potassium deficiency symptoms across the region. For the future, the best preventative strategy is precision soil sampling (grid or zone) and fertilizing accordingly. It is important to identify and address those parts of fields where potassium may be limiting crop yield potential and spend fertilizer dollars where needed.
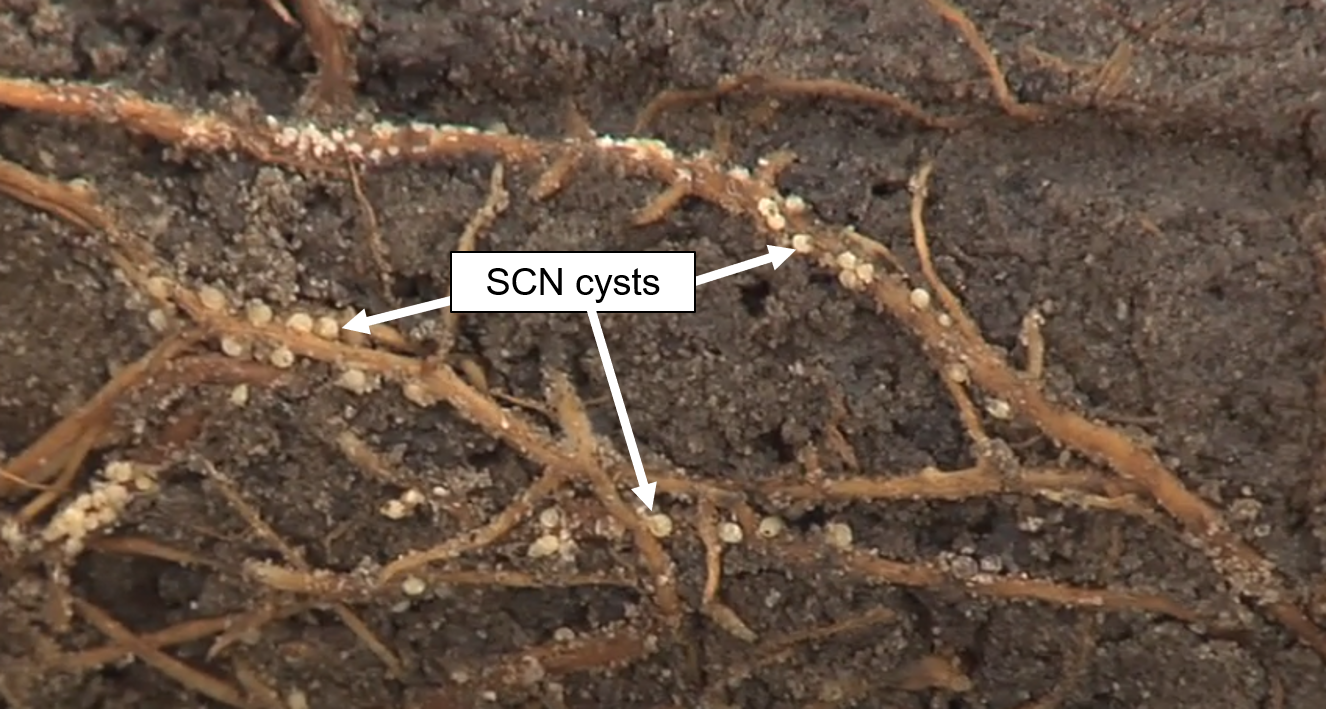
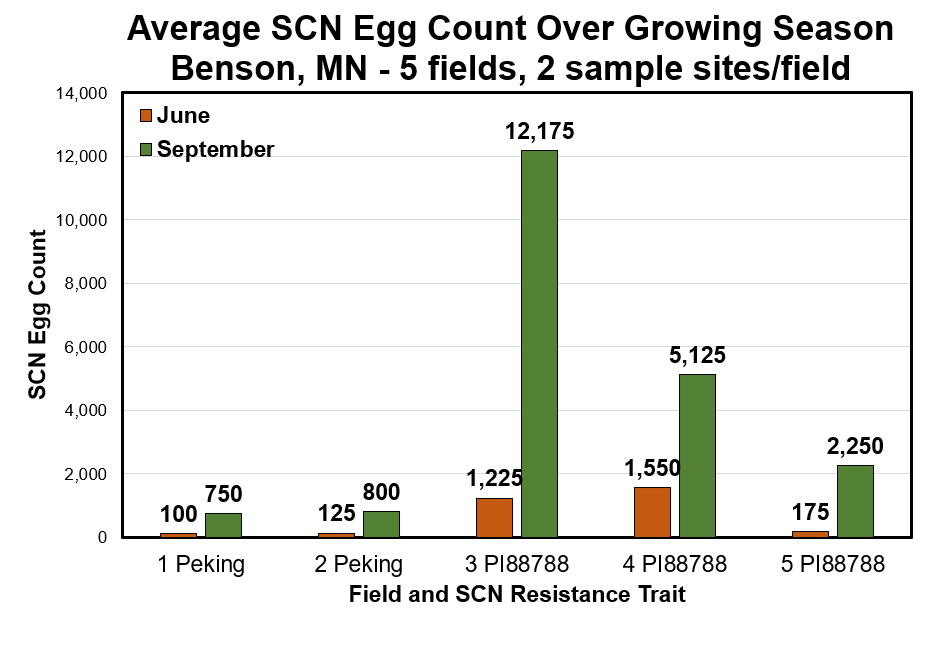
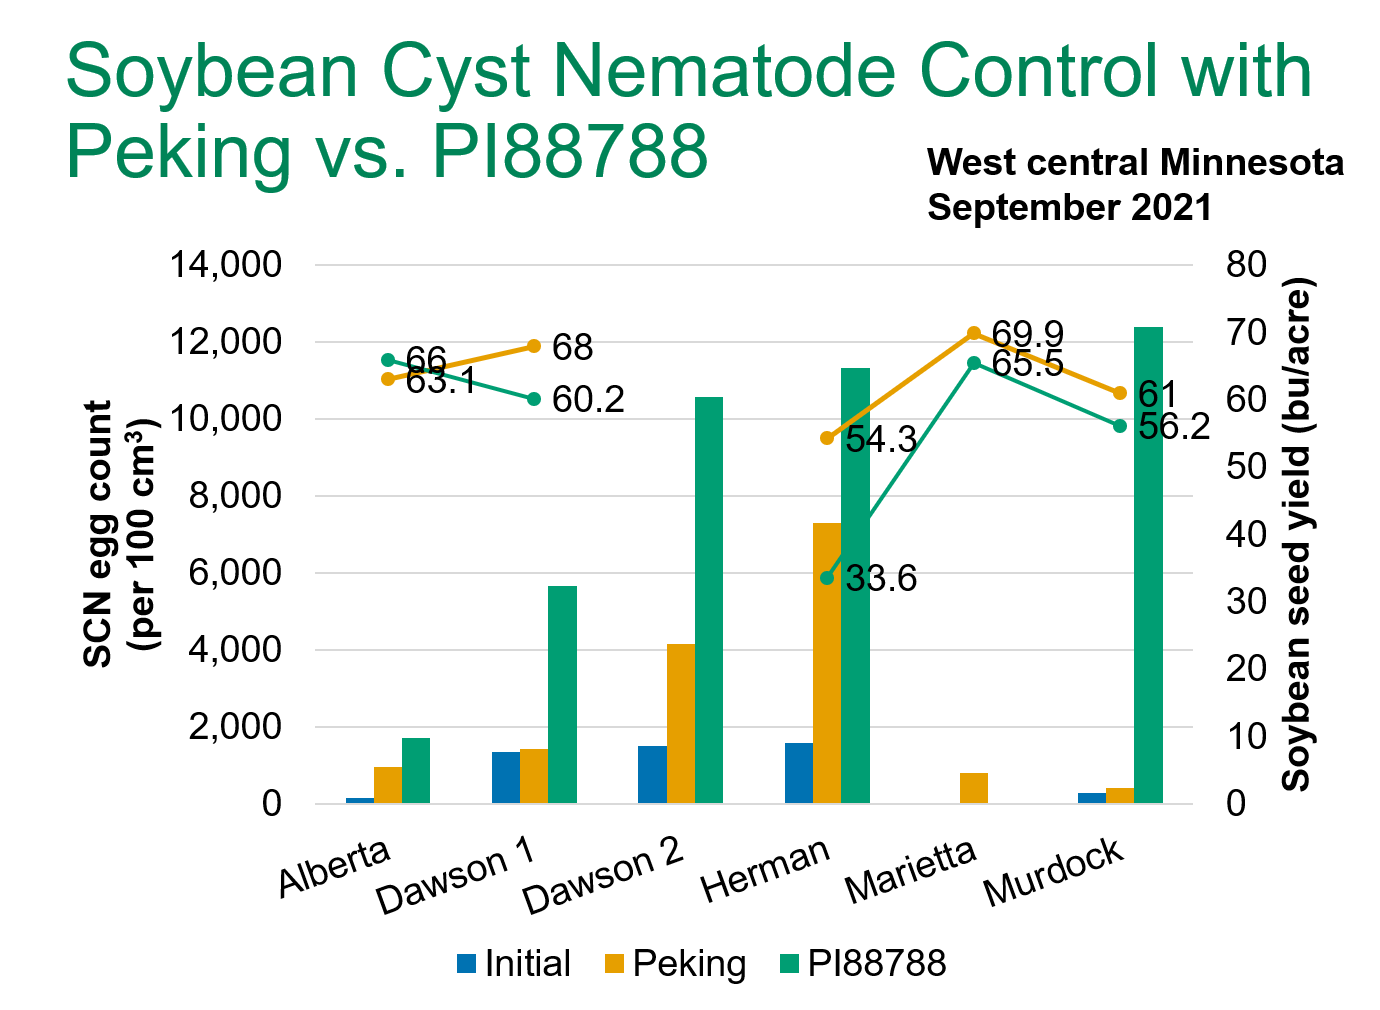
Is PI 88788 Working in Your Soybean Fields?

Soybean Cyst Nematode (SCN) is the number one yield-reducing pest in soybeans. Potential yield loss to SCN is expected to rise as more and more populations of SCN overcome the PI 88788 source of resistance. The Peking source of SCN resistance is not near as common as the PI 88788 source but is used in several soybean varieties.

If you want to see how the SCN resistance source in your soybeans is holding up this growing season, you can do an early and late SCN soil test. If the egg count increases substantially between the early and late SCN sample, your SCN resistance source is likely failing.

Here are the 4 steps to this simple test:

Early SCN sample (June): 

  1. Choose a spot in a current soybean field
  2. Collect 8 to 10 0-6″ soil cores taken within the soybean row at that spot
  3. Mark that spot with a flag or GPS so you can get back to that spot to sample later in the season

Late SCN sample (mid to late August): 

4. Go back to the same spot you collected a soil sample from in June and repeat step #2

Once you’ve conducted this simple test, you will get an idea of whether or not the SCN resistance source in your soybean variety is holding up or if it is time to change the resistance source in next year’s varieties. AGVISE completed a field project using a similar procedure in 2019 and 2020. The data showed that the PI 88788 trait was not preventing SCN populations from increasing in some field sites tested in Minnesota. You can read more about our project here.


Data from the AGVISE SCN field project, 2019-2020

A silver bullet for managing SCN does not exist and will likely never exist. Do your due diligence and figure out if your SCN resistance source is working in your own fields.

You can order SCN submission forms from our online supply store here.

Additional resources:

SCN in Iowa: A Serious Problem that Warrants Renewed Attention

Iowa State University – SCN Resources


Soybean cyst nematode: Failing resistance traits, increasing SCN populations

Originally featured in the Winter 2020-2021 AGVISE Laboratories Newsletter

In 2019, AGVISE Laboratories investigated if popular soybean varieties with PI88788 or Peking SCN-resistance traits were effectively providing protection from soybean cyst nematode (SCN) and found that a number of the varieties failed to do so. We expanded the project in 2020 with cooperation from agronomists in west-central Minnesota.

For over 20 years, PI88788 has been the primary SCN-resistance trait in over 95% of soybean varieties. In the past few years, university research is showing that PI88788 is losing its effectiveness at controlling SCN. Detecting SCN-resistant trait failure with the naked eye is impossible, unlike the detection of failed pesticide control, where you can still see a herbicide-resistant weed that is growing vigorously. Therefore, we wanted to demonstrate how you can measure SCN resistance with soil sampling, even though you cannot see it with your naked eye.

In the project, we had 41 soybean fields with SCN-resistant varieties, 35 with the PI88788 trait, and 6 with the Peking trait. In each field, a location was flagged and soil sampled for SCN egg count in early (June) and late (September) parts of the growing season. From June to September, the SCN egg count increased by 4.9 times on average across all 41 soybean fields (individual field reproduction factor ranged from 1.2 to 12.9). In some fields, the high SCN reproduction rate shows that SCN were successfully reproducing on soybean plants and the SCN resistance trait is failling. We also learned that soybean varieties with the Peking trait had much better control of SCN than those with the PI88788 trait. One cooperator from Benson, MN grew both PI88788 and Peking soybean varieties on his farm. He noted a 2.5 bu/acre soybean yield advantage with the Peking soybean variety (56.5 bu/acre) over the PI88788 soybean variety (54.0 bu/acre).

The project showed that SCN soil sampling in the early vs. late growing season was a simple way to detect a failing SCN resistance trait. The simple protocol only takes a big flag to mark the spot, then a set of soil samples in June and September to compare the SCN egg count results.


Scouting Shorts: Soybean Iron Deficiency Chlorosis (IDC)

As soybean plants emerge and add trifoliate leaves, keep your eyes peeled for soybean iron deficiency chlorosis (IDC). Through the upper Midwest and into the Canadian Prairies, soils with high pH and calcium carbonate pose a special problem for soybean plants and iron uptake. If you encounter soybean IDC, you will start to notice soybean plants with distinct interveinal chlorosis (yellow leaf with green leaf veins) in the newest leaves. The unifoliate leaves typically remain green.

Look for characteristic symptoms of soybean IDC (above photo).

When to scout

Right now! Soybean IDC symptoms begin to appear as soybean plants enter the first- to third-trifoliate leaf stage. You will often see soybean IDC symptoms appear after a period of cool, wet weather.

Where to look

Soybean IDC symptoms are usually confined to soybean IDC hotspots with high carbonate and salinity. Soil pH is not a good indicator of soybean IDC risk because some high pH soils do not have high carbonate or salinity, which are the two principal risk factors. The soybean IDC hotspots often occur on landscape positions with moderate to poor drainage, but soybean IDC symptoms may appear across the entire field if high carbonate and salinity are present throughout the field. High residual soil nitrate-nitrogen can also make soybean IDC worse, so take an extra look at fields that were fallowed last year (e.g. Prevented Planting) and had higher soil nitrate-nitrogen than normal.

What soybean IDC can be confused with

Nitrogen deficiency: Pale green and yellowing is uniform across the entire leaf and veins (not interveinal like soybean IDC). Yellowing appears on older leaves. It is sometimes observed when poor inoculation or delayed nodulation occurs. Look at soybean roots for active nodules (bright pink-red center) or take plant and soil samples to confirm.

Potassium deficiency: Yellowing starts at the outer leaf margin, works its way inward with some brown mottling. Yellowing appears on older leaves during early growth stages and sometimes on upper leaves during pod fill. Take plant and soil samples to confirm.

Soybean cyst nematode (SCN): Aboveground symptoms are virtually invisible during the early growing season. Visual SCN symptoms only occasionally appear in late July or August, or if dry soil conditions occur. Look at soybean roots for small white-colored SCN cysts or take an SCN soil sample including infected root material to confirm.

More information on soybean IDC symptoms, causes, and management: https://www.agvise.com/soybean-iron-deficiency-chlorosis-symptoms-causes-and-management/