This submission is courtesy of Dr. Heather Matthees, Research Soil Scientist, USDA-ARS, Morris, MN. It was originally published in the AGVISE Newsletter Fall 2017.
Salt-affected soils are a major problem for agricultural producers, resulting in $12 billion annual losses in crop production across the world. In the northern Great Plains and Canadian Prairies, soil salinity has always existed in some soils of the region, but the problem has become more widespread and severe since a hydrological wet period began in the 1990s.
Salinity is the overall abundance of soluble salts, which compete with plant water uptake and reduce crop productivity. The soluble salts pull soil water toward themselves in the soil solution, which leaves less soil water available for plant uptake. This causes an apparent drought stress, reducing crop productivity and sometimes may kill the plant. Soluble salts are naturally occurring and a product of regional geology in the northern Great Plains and Canadian Prairies. Since the 1990s, the hydrological wet period has raised the groundwater level and allowed saline groundwater to rise toward the soil surface, causing soil salinization. Saline soils are often called “salty,” “sour”, or “white alkali.”
The severity of soil salinity will control which plant species are suitable for crop or forage production. Some crop species like dry bean and soybean are very sensitive to salinity, whereas other crop species like barley and sunflower have good tolerance to salinity. For soils with very high salinity, the only practical forage option may be salt-tolerant perennial grasses. To assess soil salinity, there are two soil analysis methods: saturated paste extraction and routine 1:1 soil water methods.
Saturated Paste Extraction Method
The gold standard in soil salinity research is the saturated paste extraction method. The method requires a trained laboratory technician to mix soil and water into a paste, just reaching the saturation point, which is about the consistency of pudding. The saturated paste rests overnight to dissolve the soluble salts. It is then is placed under vacuum to draw the saturated paste extract. Soil salinity is then determined by measuring the electrical conductivity (EC) of the saturated paste extract.
The saturated paste extraction method is fairly straightforward, but it requires a trained technician, specialized equipment, and over 24 hours to complete the procedure. The procedure is labor intensive and difficult to automate, so it is considered a special analysis service in commercial soil testing. Therefore, it is more expensive than routine soil testing methods. Among soil salinity determination methods, it is considered the most accurate because the soil:water ratio at saturation controls for differences in soil texture and water holding capacity.
Routine 1:1 Soil:Water Method
The routine method for soil salinity assessment is the 1:1 soil:water method, which mixes standard mass of soil (10 g) and volume of water (10 mL) in a soil-water slurry. Soil salinity is then determined by measuring the electrical conductivity (EC) of the soil-water slurry. It is most commonly abbreviated EC1:1.
The method is fast and inexpensive (only 5-10% of saturated paste extraction cost). The low cost per soil sample allows a person to collect more soil samples from various soil depths and multiple locations within a field (e.g. zone soil sampling), which can create a more comprehensive and detailed soil salinity map to evaluate soil salinity presence, severity, and variability. Since soil salinity is so intimately related to soil water movement across the landscape, the soil salinity map also provides information about soil water accumulation and leaching, soil nutrient movement (e.g. chloride, nitrate-nitrogen, sulfate-sulfur), and crop productivity potential.
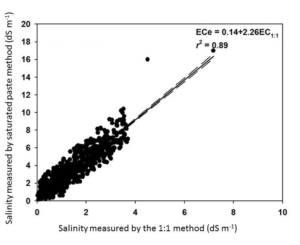
A general caveat about the 1:1 soil:water method is that the reported values will be lower than the saturated paste extraction method. Fortunately, the two methods are highly correlated. AGVISE Laboratories worked with soil science researchers at North Dakota State University and South Dakota State University to validate the correlation between the two methods using over 2,300 soil samples from the northern Great Plains. You can convert the two methods by multiplying the 1:1 soil:water result by 2.26 to estimate the saturated paste extraction result (Figure 1).
The simple method conversion enables you to quickly and cheaply monitor soil salinity using the 1:1 soil:water method and still utilize the historical soil salinity interpretation criteria based on the saturated paste extraction method.

Figure 1. Soil salinity method conversion between saturated paste extraction and 1:1 soil:water methods.
References
Matthees, H. L., He, Y., Owen, R. K., Hopkins, D., Deutsch, B., Lee, J., Clay, D. E., Reese, C., Malo, D. D., & DeSutter, T. M. 2017. Predicting soil electrical conductivity of the saturation extract from a 1:1 soil to water ratio. Communications in Soil Science and Plant Analysis, 48(18), 2148–2154.
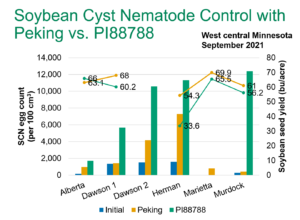
 SCN egg count and soybean yield data from the 2021 AGVISE SCN resistance project. Bars of the graph represent SCN egg count, lines of the graph represent soybean yield. Click on the graph for a higher resolution version.

