Zone Soil Sampling: How Many Zones?

Zone soil sampling has become a standard practice in precision nutrient management, but the grand question remains – How many zones should you be soil sampling?

Well, it depends! It just makes sense that a field with more variability requires more zones than a field with little variability. Zone soil sampling separates parts of fields that behave differently into similar zones that can be managed together. Common data layers used to build zone soil sampling maps include satellite imagery, plant vegetation indices, crop yield, salinity, topography, and even bare soil color.

As a soil testing laboratory, AGVISE does not know what data layers are used to create the zone maps, but we do know the soil nutrient levels in each zone. Clients often ask how many zone soil samples should be collected in each field to get the best soil nutrient information. Common sense tells us that splitting fields into more zones should provide more detailed soil nutrient data.

With soil test data from thousands of zone soil sampled fields, we mined the AGVISE database to see what the average range in soil test levels per field (high testing zone minus low testing zone) could tell us about field variability and the number of zones that should be sampled. The table summarizes the average range in soil test levels for over 24,000 zone soil sampled fields in 2023. The number of zones ranges from 3 to 8 zones per field. You can see, as the number of zones increases, the difference between the high zone and low zone gets larger and larger.

This data reminds us that more zones per field can tell us more about the soil nutrient status in each field, providing more powerful information to develop variable-rate fertilizer applications. If you have variable landscapes with rolling topography, diverse soil types, or salinity problems, you may have to take more zone soil samples per field (5-7 zones) to see the greatest differences in soil fertility and to take full advantage of variable-rate fertilizer applications. If your landscapes have less variability with fewer soil types, relatively flat topography, and no salinity problems, then you can probably take fewer zone samples per field (3-4 zones).

Soil Nitrogen Trends – Fall 2023: Some Up, Some Down

The 2023 drought was an all-too-soon reminder of the widespread 2021 drought. It covered much of the upper Midwest, Great Plains, and Canadian Prairies. From previous experience with droughts, we expected that residual soil nitrate-N following crops would be higher than normal, caused by the drought and reduced crop yields. The first wheat fields that were soil tested in August and September confirmed our expectation that residual soil nitrate-N was already trending higher than normal. Yet, some regions were spared the drought and received above-average rainfall, and achieved record-setting crop yields. For these regions, the amount of residual soil nitrate-N after high-yielding crops was near or below average. 

The 2023 AGVISE soil test summary data highlights the great variability following the drought. The median amount of soil nitrate-nitrogen across the region was higher than the long-term average following wheat. Over 28% of wheat fields had more than 60 lb/acre nitrate-N (0-24 inch) remaining. Yet, another 17% of wheat fields had less than 20 lb/acre nitrate-N remaining, suggesting either lost crop yield or protein due to insufficient nitrogen nutrition. For any given farm, the great variability in residual soil nitrate-N across all acres makes choosing one single nitrogen fertilizer rate impossible for next year, and soil testing is the only way to decide that right rate for each field.

Through zone soil sampling, we are also able to identify that residual soil nitrate-nitrogen can vary considerably within the same field. This makes sense because we know that some areas of the field produced a fair or good yield, leaving behind less soil nitrate, while other areas produced very poorly and left behind much more soil nitrate. These differences across the landscape are driven by soil texture, soil organic matter, and stored soil water as well as specific problems like soil salinity or low soil pH (aluminum toxicity). Although the regional residual soil nitrate-nitrogen trends were higher overall, it is truly through zone soil sampling that we can begin to make sense of the field variability that drives crop productivity and determine the right fertilizer rate for next year.

For fields that have not been soil tested yet, there is still time to collect soil samples in winter. Nobody wants to experience another drought, but this kind of weather reminds us how important soil nitrate testing is every year for producers in the Great Plains and Canadian Prairies. Each year, AGVISE summarizes soil test data for soil nutrients and properties in our major trade regions of the United States and Canada. For more soil test summary data and other crops, please view our soil test summaries online: https://www.agvise.com/resources/soil-test-summaries/

Early Soil Nitrate Trends after Wheat in 2022

Small grain harvest is well underway across the region, and soil testing is progressing quickly. Crop yields have varied from below average to exceeding expectations across the region and often in the same area. Planting date, summer temperatures, and rainfall (too little or too much) were major factors this year.

The major factors influencing the amount of residual soil nitrate-N after crops are:

1.     Nitrogen fertilizer rate: too high or too low
2.     Crop yield achieved: much lower or higher than expected
3.     Nitrogen losses: denitrification and leaching after too much rainfall
4.     Nitrogen mineralization from organic matter: cool or warm growing season

Seasonal weather is a large driving factor in the amount of nitrate-N in the soil profile. This changes from field to field and year to year. Early spring weather conditions were very wet across much of the region. In June and July, some areas continued to receive adequate to excess rainfall. Meanwhile, other areas received very little rain in the late growing season.

AGVISE has tested over 10,000 soil samples from wheat fields across the region. The table below indicates the percentage of soil samples in each soil nitrate-nitrogen category in several areas of Manitoba, Minnesota, North Dakota, and South Dakota. The data should give you a general idea of how variable residual soil nitrate is from field to field in each region. With such variable crop yields, there is quite a bit of variability in residual nitrate following wheat in the region. In drought-affected areas of Minnesota, North Dakota, and South Dakota, over 10 to 20% of soil samples have more than 60 lb/acre nitrate-N (0-24 inch soil profile) remaining after wheat.

What about Prevented Planting or unseeded acres?

For Prevented Planting or unseeded acres, the factors above plus some additional factors will affect the amount of residual nitrate-nitrogen:

1.     How long was water standing on the field?
2.     Was weed growth controlled, early or late?
3.     Was tillage used? How many times? How deep?
4.     Was a cover crop planted? What amount of growth was achieved?

When submitting soil samples from fields that were not planted, please choose “Fallow” or “Cover Crop” as the previous crop. This will allow us to send additional information on soil nitrate trends for unseeded and cover crop fields once we get enough data.

As the fall soil testing season continues, we will keep you updated. If you have any questions, please call our experienced agronomic staff. We hope you have a safe harvest and soil testing season.


2021 Drought: High residual soil nitrate-nitrogen across the region

This article originally appeared in the AGVISE Laboratories Winter 2022 Newsletter

The 2021 drought rivals the 1988 drought, and it covered much of the northern Great Plains and Canadian Prairies. From previous experience with droughts, we expected that residual soil nitrate-N following crops would be higher than normal, caused by the drought and reduced crop yields. The first wheat fields that were soil tested in August and September confirmed our expectation that residual soil nitrate-N was already trending much higher than normal.

The 2021 AGVISE soil test summary data highlights how exceptional the 2021 drought was. The median amount of soil nitrate-N across the region was markedly higher following wheat and corn. Over 20% of wheat fields had more than 100 lb/acre nitrate-N (0-24 inch) remaining, and another 40% of wheat fields had a sizable 40 to 80 lb/acre nitrate-N (0-24 inch) left over. For any given farm, the great variability in residual soil nitrate-N makes choosing one single nitrogen fertilizer rates impossible, and soil testing is the only way to decide that right rate for each field.

Through zone soil sampling, we were also able to identify that residual soil nitrate-N varied considerably within a field. This makes sense because we know that some areas of the field produced a fair yield, leaving behind less soil nitrate, while other areas produced very poorly and left behind much more soil nitrate. These differences across the landscape are driven by soil texture, soil organic matter, and stored soil water as well as specific problems like soil salinity or low soil pH (aluminum toxicity). Although the regional residual soil nitrate-N trends were higher overall, it is truly through zone soil sampling that we can begin to make sense of the field variability that drives crop productivity and the right fertilizer rate for next year.

For fields that have not been soil tested yet, there is still time to collect soil samples in winter (see winter soil sampling article). Nobody wants to experience another drought, but this kind of weather reminds us how important soil nitrate testing is every year for producers in the Great Plains. Each year, AGVISE summarizes soil test data for soil nutrients and properties in our major trade region of the United States and Canada. For more soil test summary data and other crops, please take a look at our soil test summaries online.


Controlling Soybean Cyst Nematode: Do you have a resistance problem?

This article originally appeared in the AGVISE Laboratories Winter 2022 Newsletter

This is the third year of our soybean cyst nematode (SCN) resistance project. Each year, we have flagged spots in soybean fields and collected paired SCN soil samples in June and September. If the SCN egg count increases through summer and into fall, we can quickly learn if the soybean SCN-resistance source, either PI88788 or Peking, is working or failing. University SCN surveys have found that the PI88788 resistance source has begun to lose its effectiveness at controlling SCN populations in much of Minnesota. This is a particular problem because 95% of SCN-resistant soybean varieties still use the PI88788 resistance source.

SCN egg count and soybean yield data from the 2021 AGVISE SCN resistance project. Bars of the graph represent SCN egg count, lines of the graph represent soybean yield. Click on the graph for a higher resolution version.

In 2021, paired soybean variety comparisons with SCN soil samples and soybean yield data really helped us see the difference in these SCN resistance sources. Among the sites, the Peking resistance source always had a lower SCN egg count than the PI88788 comparison, indicating that the Peking soybean varieties had better control of the SCN population at 4 of 5 sites. The Alberta site had similar SCN population control with both PI88788 and Peking resistance sources, so the soybean yield was similar at the site. However, the other sites demonstrated SCN resistance to PI88788, and the resulting soybean yield with the Peking resistance source was better with 7-bu/acre soybean yield increase on average.

For 4 of 5 sites, it is apparent that a Peking-traited soybean variety is the better choice. To learn if you have SCN resistance problems in your field, the simple early-late SCN soil sampling exercise, like we did in this project, is a quick way to learn if your current soybean variety is still controlling SCN and delivering the best soybean yield.


How much residual soil nitrate is left after the 2021 corn crop?

It’s probably more than you think.

So far, the residual soil nitrate-nitrogen trend following corn is much higher than average across the upper Midwest and northern Great Plains. This follows the same trend set by the 2021 wheat crop. For many growers in the region, the hot and dry growing season has resulted in high residual soil nitrate-N carryover where corn yield was lower than average. An update on average residual soil nitrate-N after grain and silage corn, broken into zip code areas, can be found below (Table 1). This data highlights the importance of soil sampling for nitrate-N, even after high N-requirement crops you may not think of leaving much residual soil nitrate-N behind.

Bar graph showing median residual nitrate-N in lb/acre for fields sampled after grain corn as of Oct. 11, 2021. Results include fields tested in MN, ND, SD, and MB. Fields tested thus far are on pace to set a record for amount of nitrate-N left after corn.

The early soil nitrate-N trend data gives us a snapshot of the soil samples that AGVISE has analyzed so far. The average soil test data is not a replacement for actual soil test results on your fields or your clients’ fields. There is considerable variability within a single zip code area, with some corn fields having less than 20 lb/acre nitrate-N and many other fields that are much higher. Take a look at eastern South Dakota, the Sioux Falls and Watertown areas have over 49% of soil samples with more than 100 lb/acre nitrate-N (0-24 inch soil depth). Considering sky-high nitrogen fertilizer prices (and still rising), it makes sense to soil test for nitrate-N and credit it toward next year’s crop nitrogen budget.

Agronomic considerations for soybean in 2022

One crop that will not benefit from extra residual soil nitrate-N after corn is soybean. Soybean can create its own nitrogen thanks to a symbiotic relationship with nitrogen-fixing bacteria. The nitrogen fixation process takes energy, however, and if there is already ample plant-available nitrate in the soil, soybean will delay nodulation and take advantage of the free nitrate. Delayed nodulation may ultimately lead to soybean yield loss.

High residual soil nitrate-N can also increase soybean iron deficiency chlorosis (IDC) severity.  Soybean IDC is a challenge for growers in the upper Midwest, northern Great Plains, and Canadian Prairies, especially on soils with high carbonate and salinity. If soil nitrate-N is also high, research has shown it can make soybean IDC even worse and result in lower soybean yield. If you plan to grow soybean on fields with high residual soil nitrate-N, seriously consider IDC-tolerant soybean varieties or consider planting them on fields with lower residual soil nitrate-N.

Should a corn-corn rotation be considered after a drought year and high soil nitrate?

Planting a second corn crop would allow a producer to capture this “free” nitrate-N in the soil profile. However, planting corn on corn has many challenges from soil moisture to insect pressures (e.g. corn rootworm). The 2021 corn crop started the growing season with a full profile of water (due to excessive moisture in 2019 and adequate moisture in 2020) and ended with enough to push the corn crop through harvest. Going into the 2022 growing season, plant available water will be considerably less than the beginning of 2021. If the drought continues into 2022, remember that corn requires more moisture than soybean, so planting corn on corn means putting a higher water-requiring crop on ground that had less water to start with (versus corn following soybeans). Less available moisture, combined with other agronomic pressures, may mean less than expected yield for a corn-on-corn rotation.

Table 1. Residual nitrate trends as of Oct. 11, 2021 from more than 2,500 soil samples taken after corn. Regions with less than 60 soil samples are not included in the table.

Understanding high residual soil nitrate-nitrogen following drought

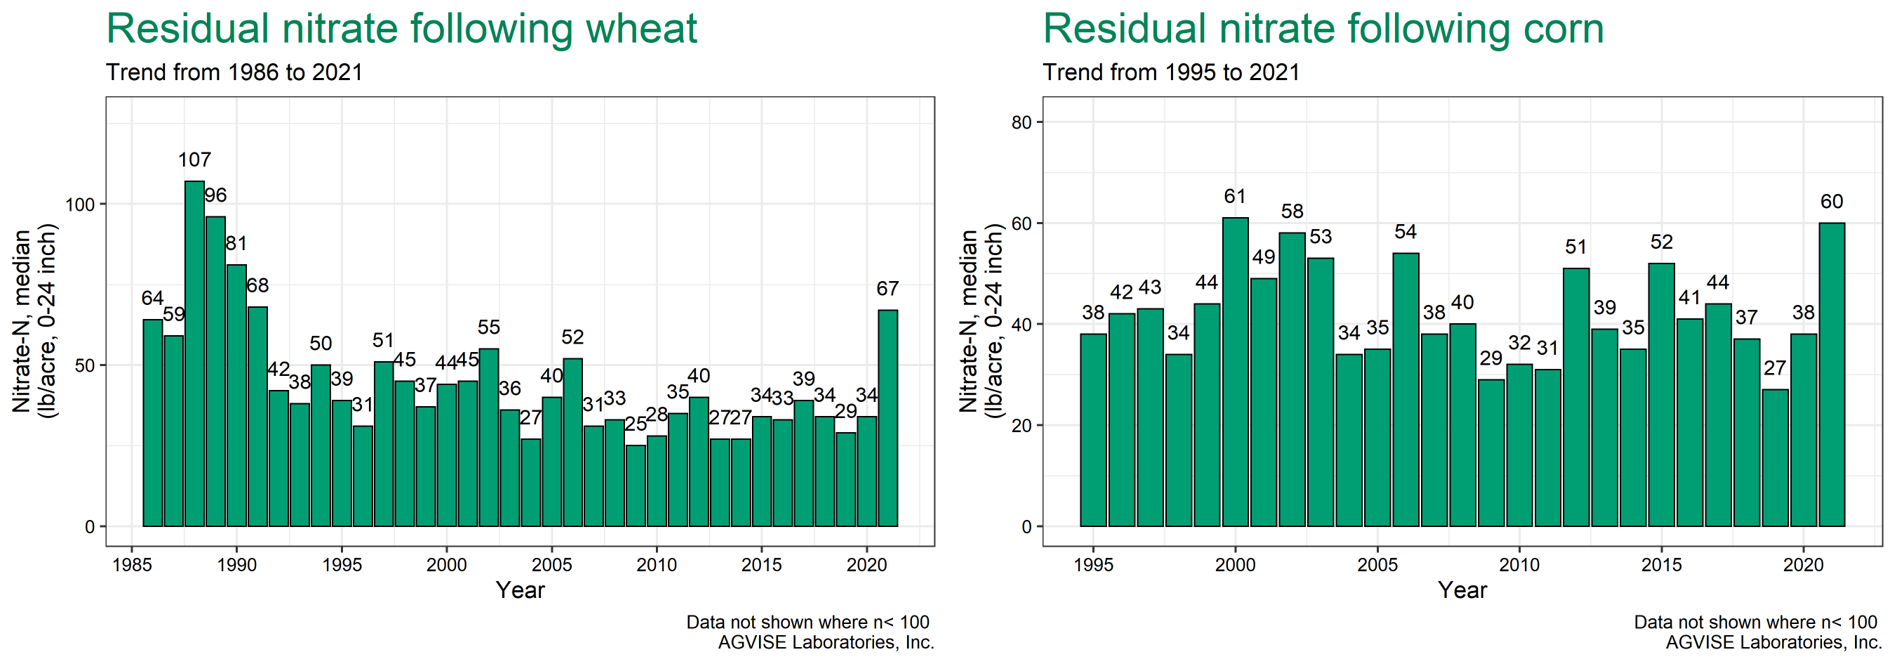
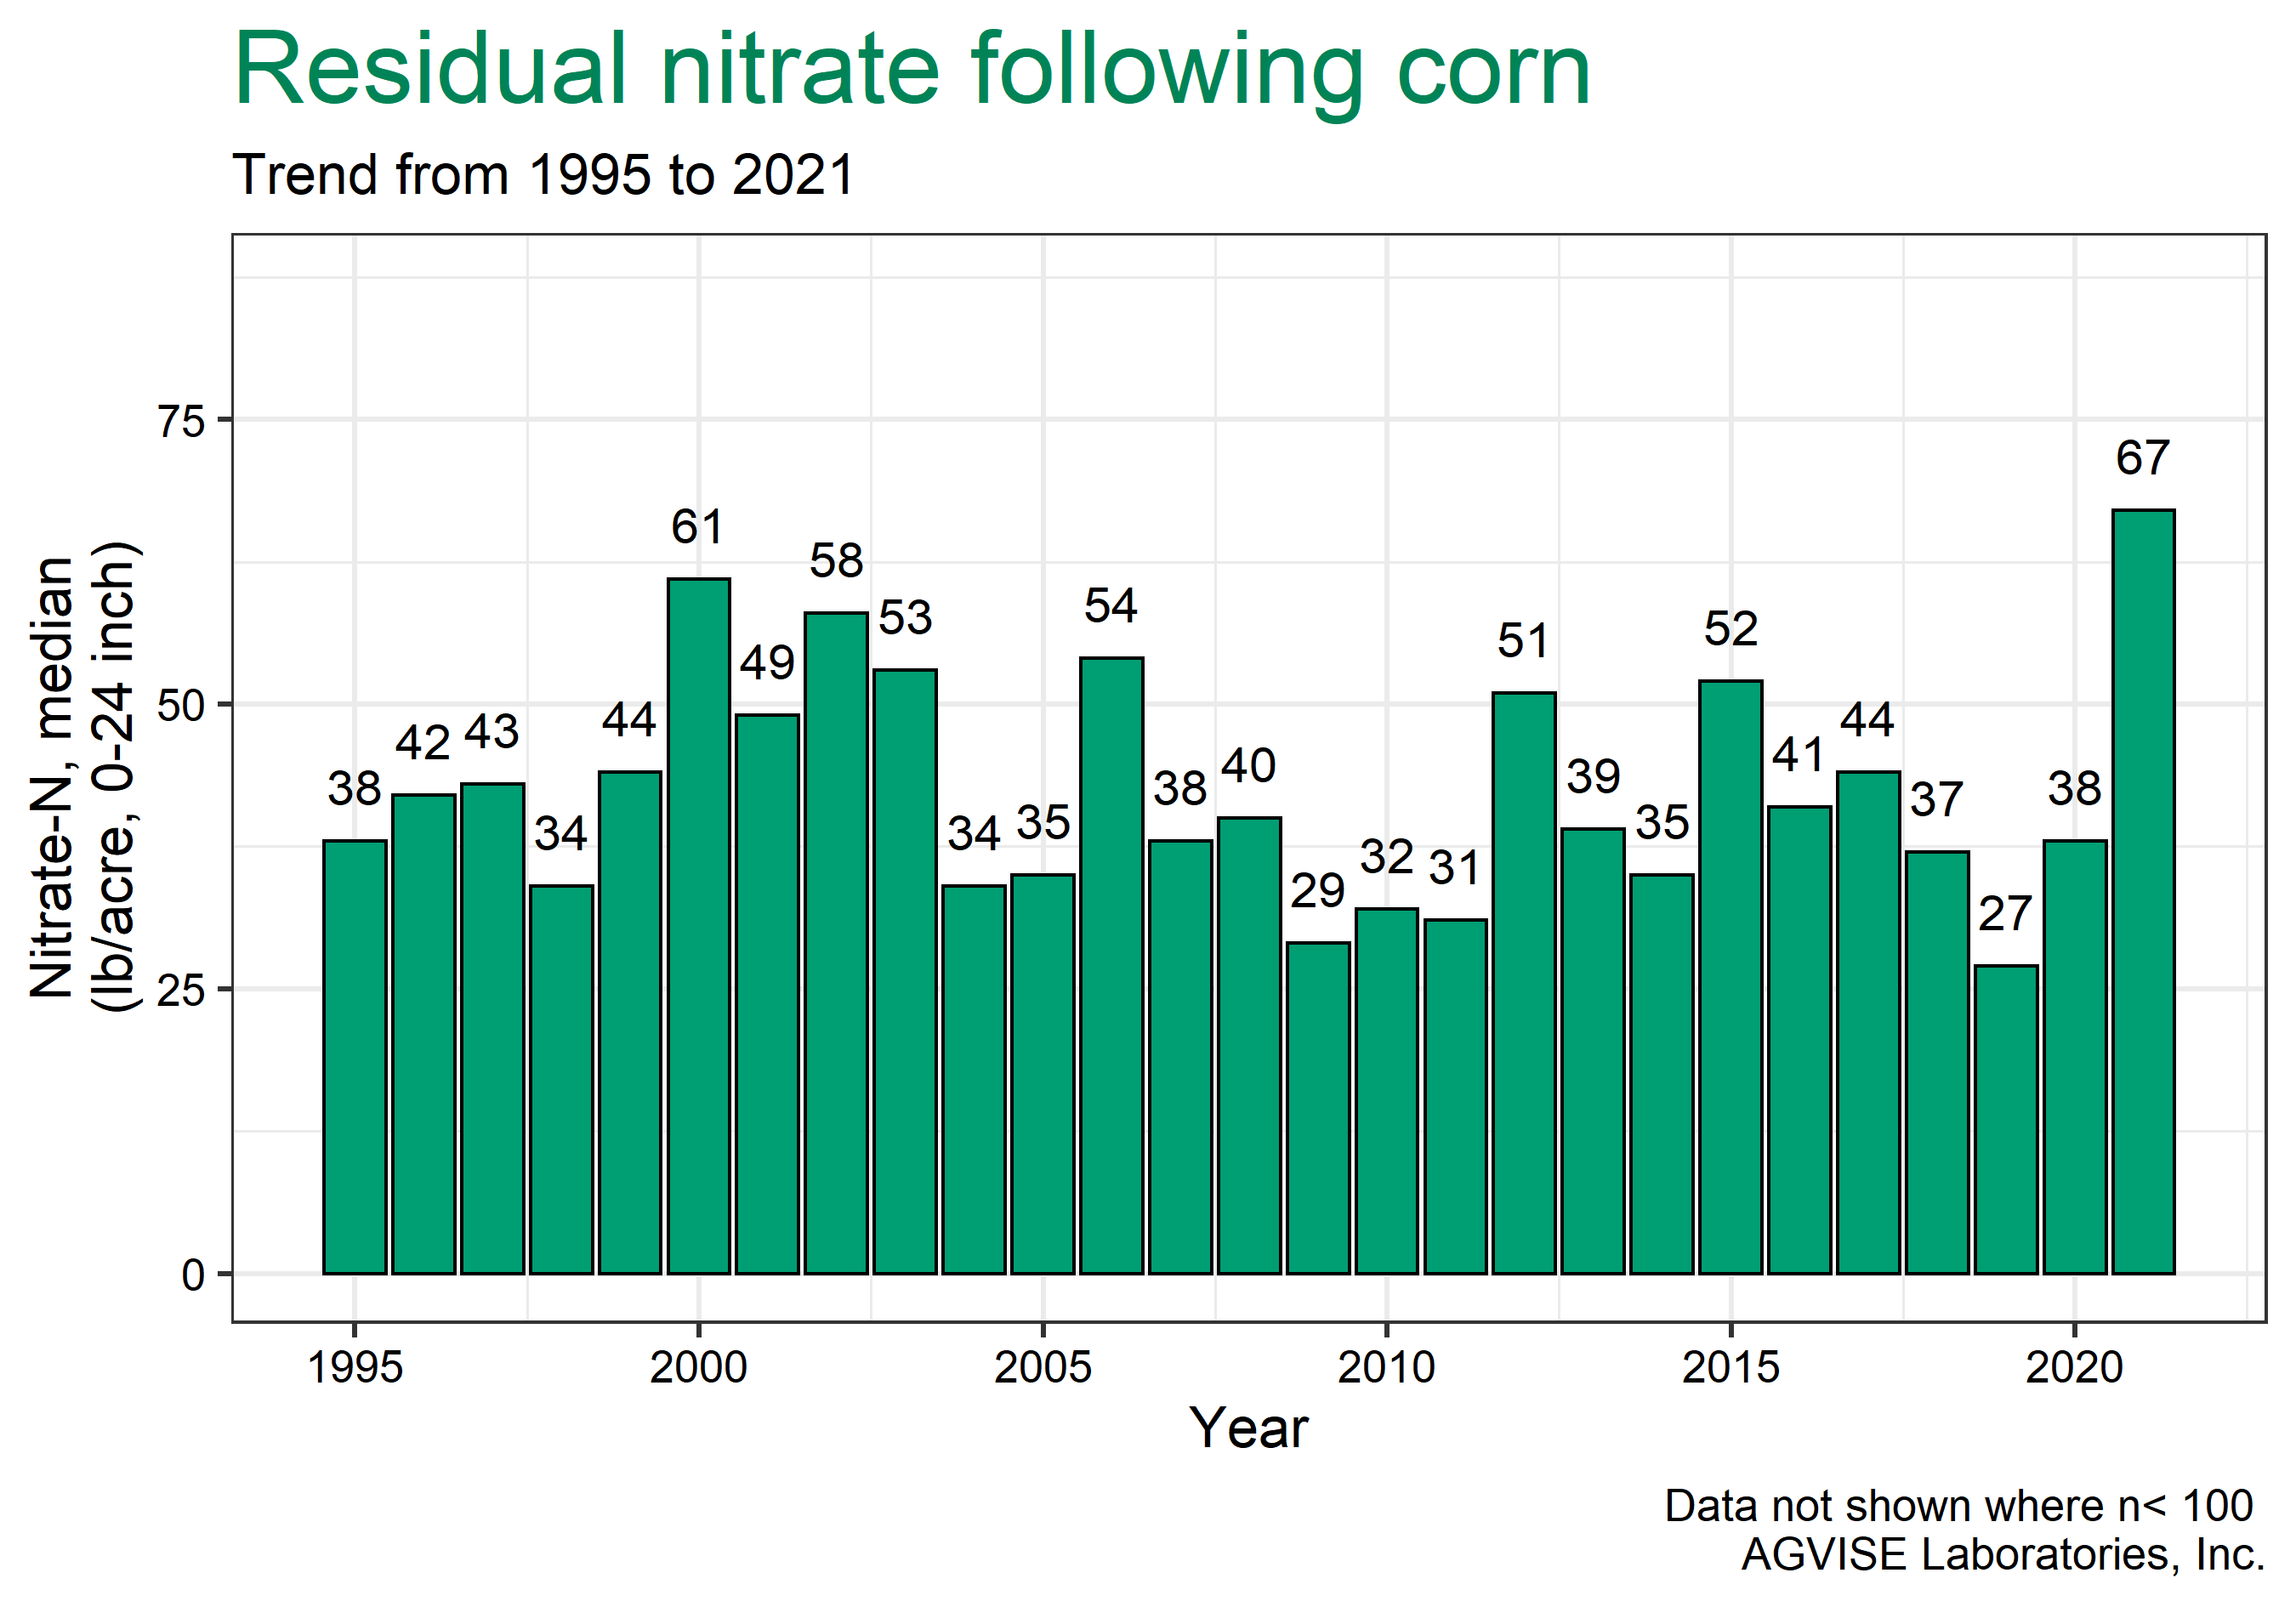
Soil testing after small grains is well underway, and we are seeing higher than normal soil nitrate-nitrogen levels, as expected. Crop yields have varied from much below average to surprisingly decent in some locations. It is easy to understand why residual soil nitrate-nitrogen is high in fields where the 2021 drought was severe and crop yield was very low. It is a little harder to understand how some fields, that produced decent crop yields, can also have higher than normal soil nitrate-nitrogen as well. Given the variability we are seeing across the region, the only way to know whether or not your fields have higher-than-expected residual soil nitrate-nitrogen or not is to sample and test these fields.

We will attempt to answer some of the questions about “Where did all the soil nitrate-nitrogen come from?” and “What should we do next year?” farther down.

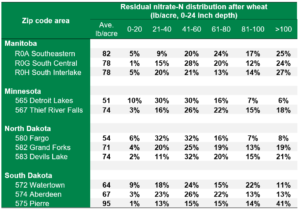
2021 Residual Soil Nitrate-Nitrogen Summary, Early Report (First 6,500 Fields)

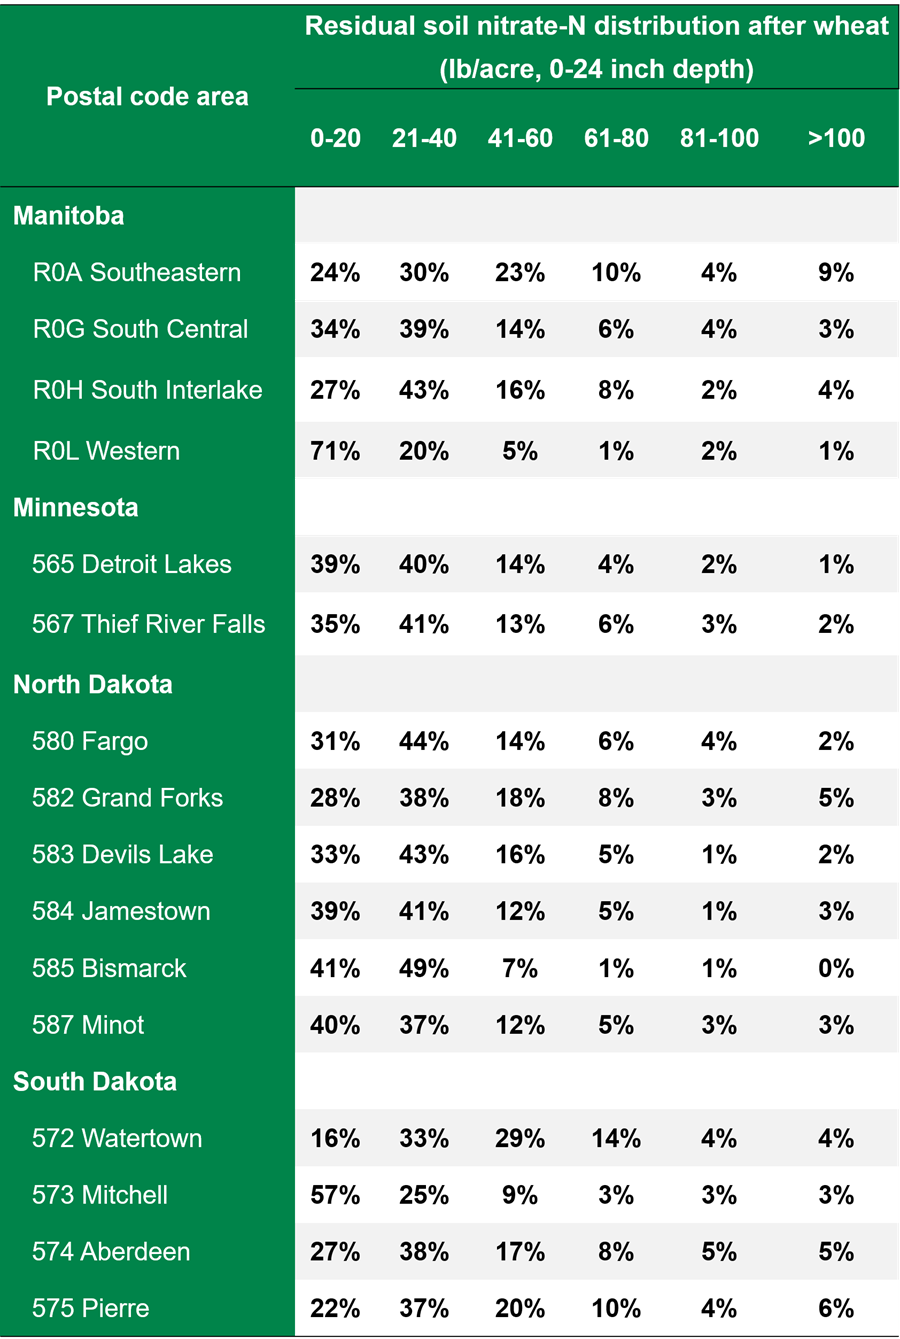
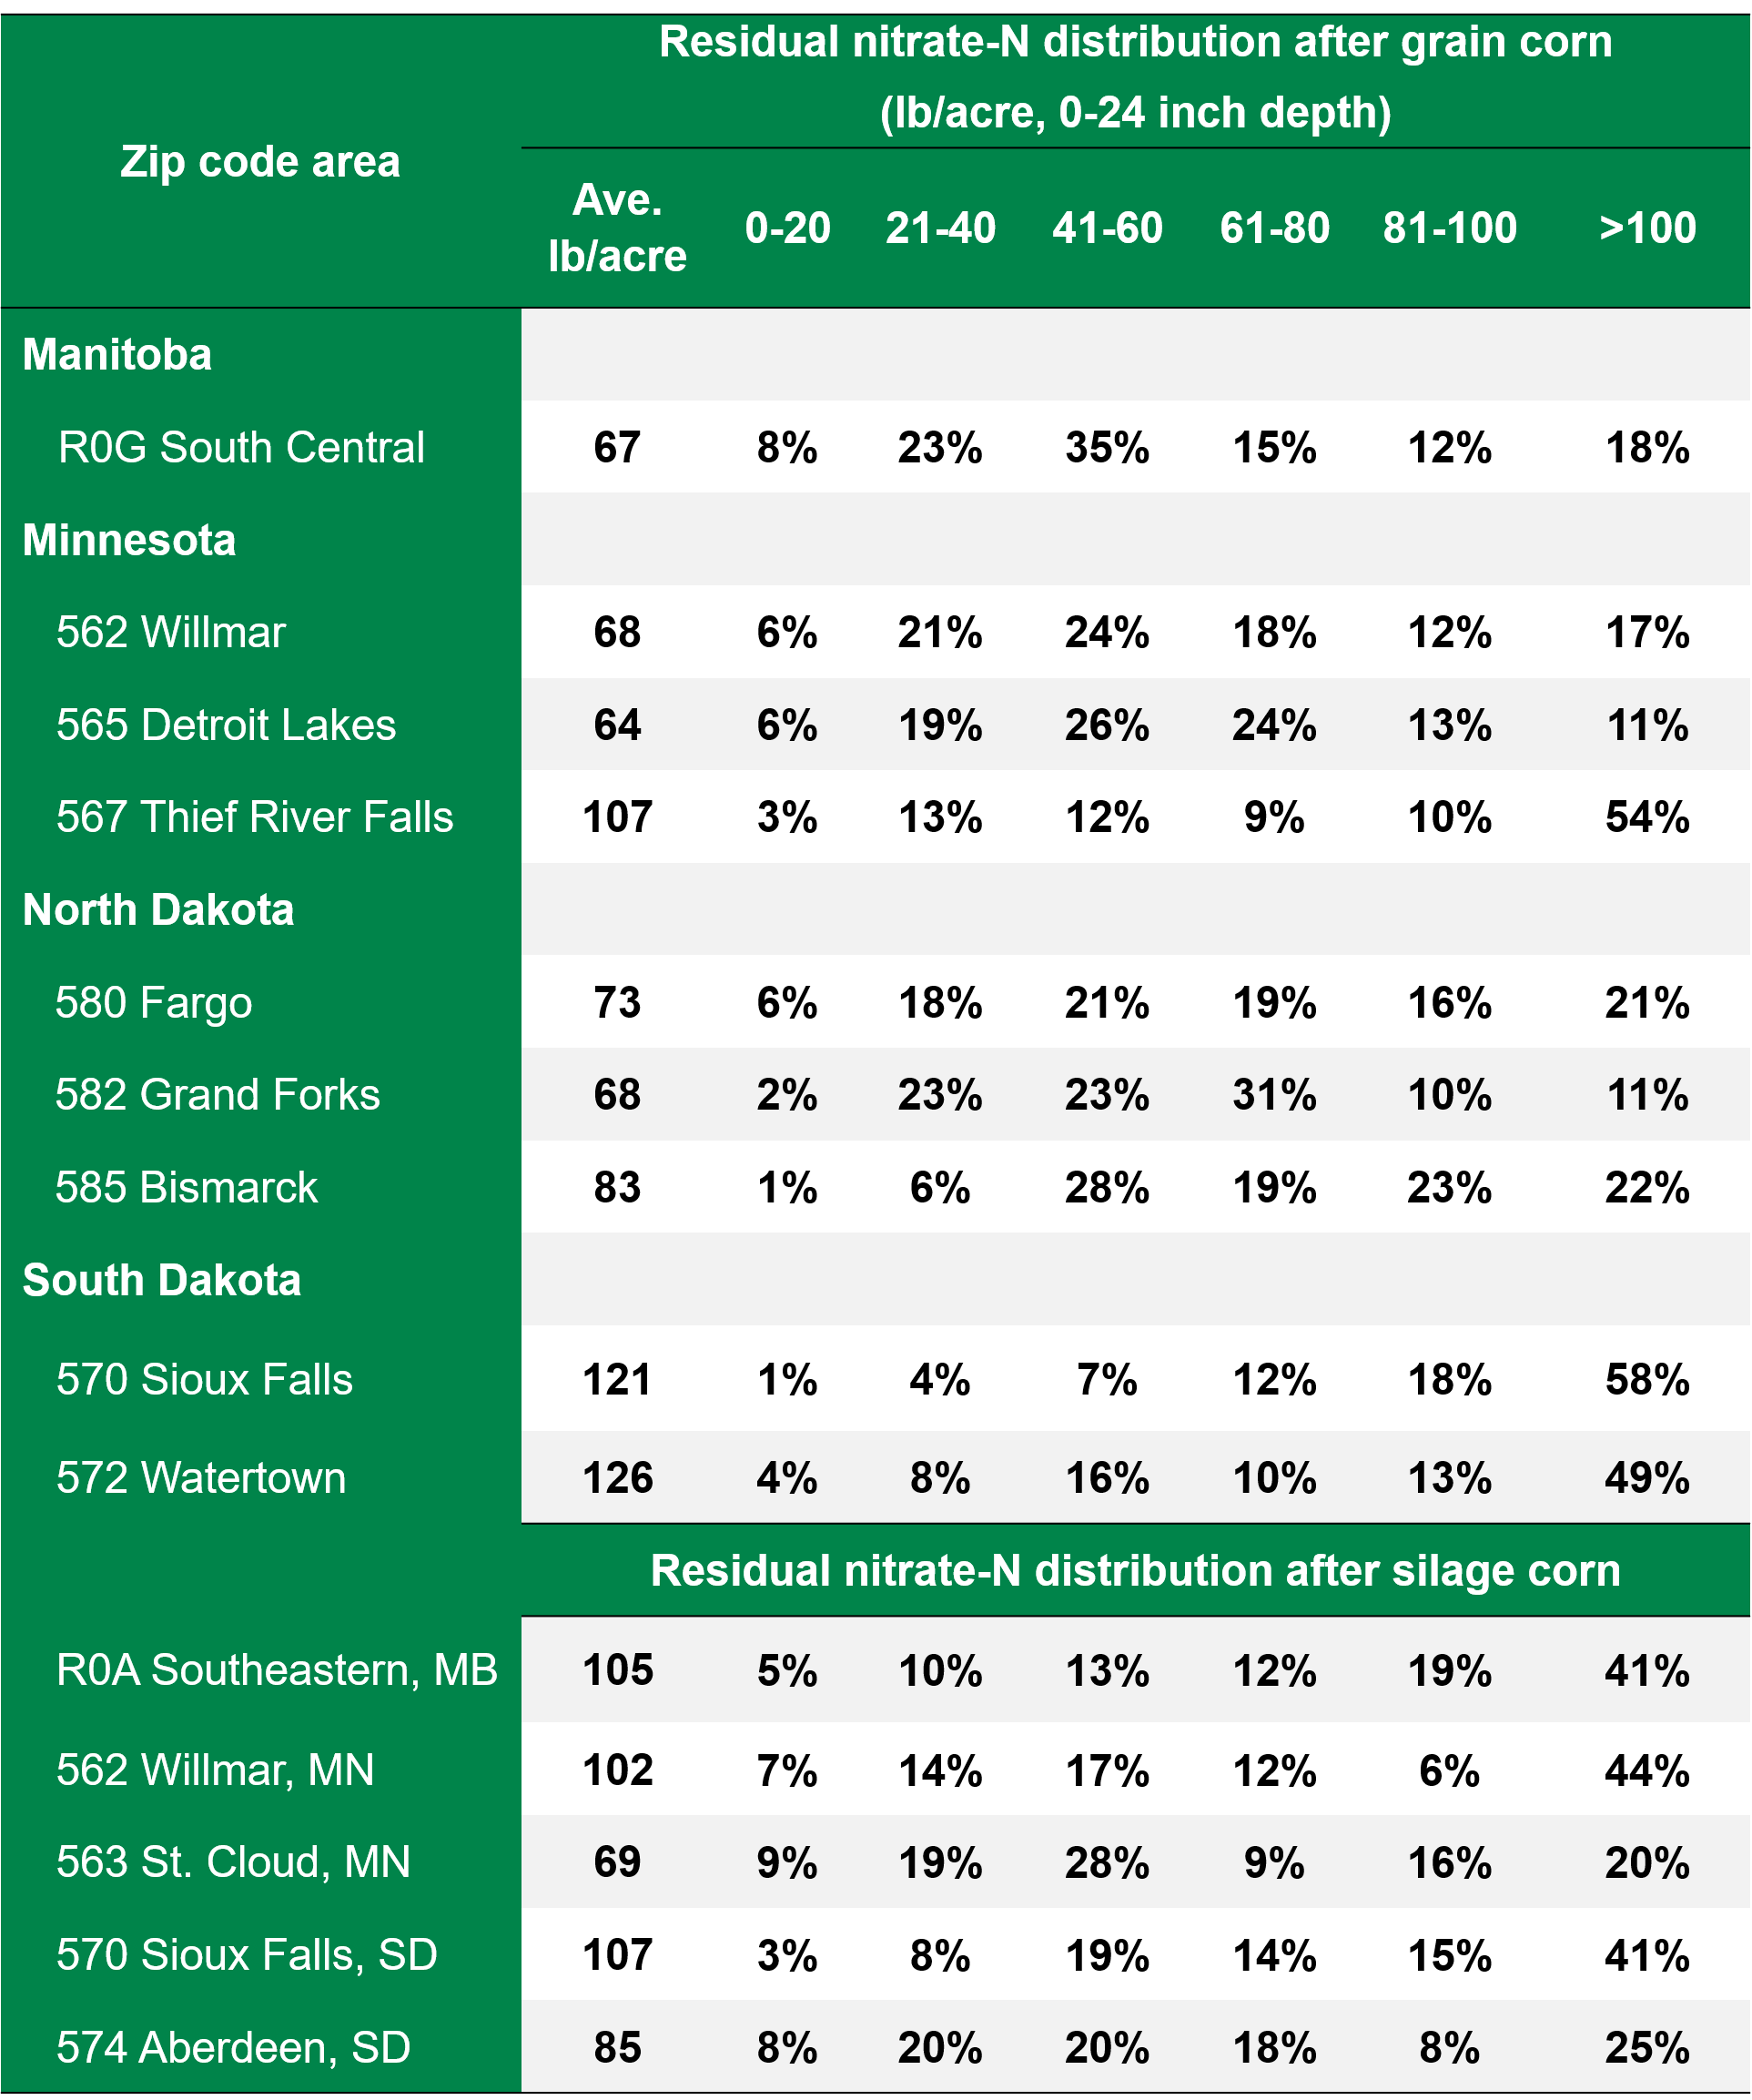
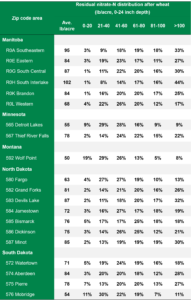
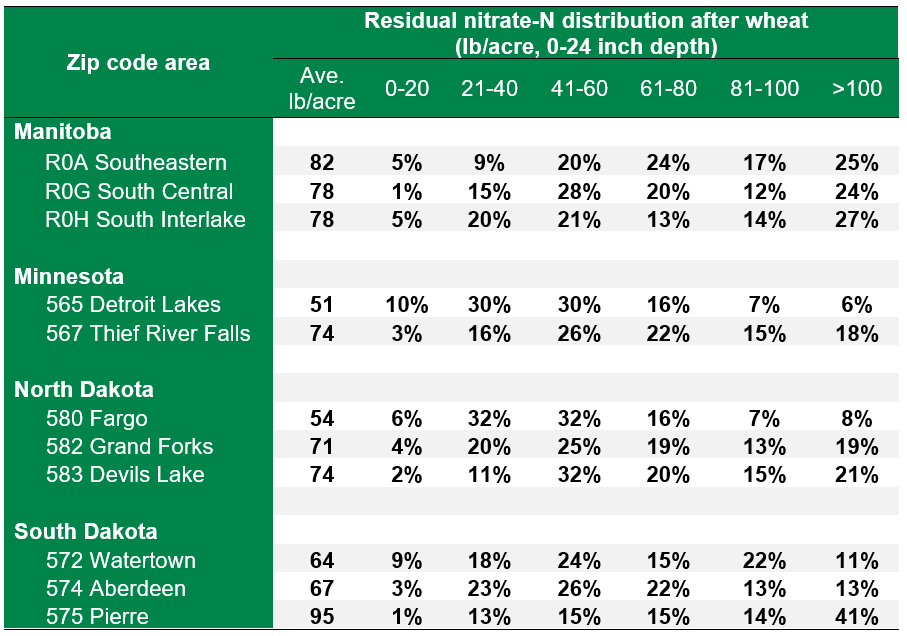
AGVISE has tested over 6,500 soil samples from wheat fields across the region so far. We usually wait to share the early soil nitrate-nitrogen summary until September, but we have been getting a lot of questions already. The table shows the average soil nitrate-nitrogen (0-24 inch soil profile) and the percentage of soil samples in each category for several areas of Manitoba, Minnesota, North Dakota, and South Dakota. As you can see, there is considerably more residual soil nitrate-nitrogen than the long-term average of 30 to 45 lb/acre nitrate-N in a good year. In some areas, over 30 to 50% of soil samples have more than 80 lb/acre nitrate-N (0-24 inch) remaining after wheat.

Reasons for high residual soil nitrate-nitrogen in a drought with low crop yield

  • Lower crop nitrogen uptake and use (low crop yield)
  • No soil nitrogen loss from leaching or denitrification
  • Warmer than average soil temperatures in the early growing season when soil water supply was better, resulting in above nitrogen mineralization from soil organic matter (can be 40 to 100 lb/acre N)
  • Nitrogen fertilizer near the soil surface was positionally unavailable because there was no soil water for plant roots to obtain it

Where did high residual soil nitrate-nitrogen come from in fields that had decent crop yields?

In 2021, crop water use demanded a lot of stored soil water uptake from deeper in the soil profile. If the crop was able to root down deep enough and fast enough, the crop found additional water in the subsoil along with nitrate-nitrogen from previous years. With the extra water and nitrate found in the deep subsoil (below 24 inches), the resulting crop yield surprised many farmers and agronomists. Just because we do not routinely collect soil samples below the 24-inch soil depth in most areas does not mean there is zero nitrate-nitrogen down there. After a series of wet years, the amount of nitrate-nitrogen that can accumulate in the lower soil profile can be considerable. In a drought year, when all crops were forced to root deeper just to survive, the deep nitrate-nitrogen makes a significant contribution to the total plant nitrogen uptake.

What about the nitrogen fertilizer that was applied last spring and all the nitrate-nitrogen in the topsoil (0-6 inch soil profile)?

With the very dry topsoil conditions, plant roots grew deeper in search of water. Since plant roots obtain most nitrate-nitrogen through mass flow in soil water, this situation left fertilizer nitrogen “stranded” and positionally unavailable near the soil surface. Although this was bad for this year’s crop, the “stranded” nitrogen is in a good position for next year’s crop. We experienced the same phenomenon in 2017 and 2018, after some areas had experienced a severe drought. There were fields with decent crop yields and considerable “stranded” nitrogen, just like this year.

Strategies to utilize high residual soil nitrate-nitrogen for next year

With so many wheat fields with high residual soil nitrate-nitrogen this fall, you may want to consider changing your crop rotation. Severe droughts like 1988 and 2021 are not very common, so we need to think outside the box. It is common for wheat to be followed in the crop rotation with a legume like soybean or dry edible bean. However, the drought has left you with a lot of residual soil nitrate-nitrogen, and nitrogen fertilizer prices are staggeringly high right now. If you have 100 lb/acre nitrate-N (0-24 inch soil profile), that is $60 per acre of “free” nitrogen fertilizer at current urea prices ($550/ton). In addition, excess soil nitrate-nitrogen can also make soybean iron deficiency chlorosis (IDC) worse on moderate to high IDC risk soils. Do you want to sacrifice $60 per acre of “free” nitrogen AND risk lowering soybean yield due to more severe soybean IDC?

Drought can be sporadic or continue for multiple years. You may want to consider more short-season crops in the crop rotation that require less water and can produce well in drier years (remember, we used most of the stored soil water in 2021). Short-season crops to consider include winter wheat, spring wheat, durum wheat, barley, canola, etc. It is also important to consider the current price for each crop. With high crop prices right now and promising futures prices in 2022, you could lock in some good prices for next year. Although two consecutive years of the same crop (e.g. wheat) is not ideal for disease management, there was very little disease in 2021, and it might allow some different weed control options for future crops in the rotation. All in all, a drought brings opportunities to think outside the box.


Lessons (Ghosts) of Droughts Past

From Alberta to Iowa, the region has experienced everything from abnormally dry soil conditions to exceptional drought. In some places, the drought started in 2020 and has continued through 2021. Considering lower than expected crop yields, we expect that residual soil nitrate-nitrogen levels will be much higher than normal in many wheat, canola, and corn fields this fall. There was reduced crop nitrogen uptake and little to no soil nitrogen losses to leaching or denitrification through the growing season, which should result in higher soil test nitrate-N remaining in the soil profile.

In major drought years, high residual nitrate levels are a normal phenomenon. In 1988, the average soil nitrate test following wheat across the region was a staggering 107 lb/acre nitrate-N (0-24 inch soil profile). This is considerably higher than the long-term average around 30-45 lb/acre nitrate-N (0-24 inch soil profile). The 1988 drought was extreme, and 2021 has rivaled that in some locations. Based on previous drought years, it will be no surprise to find wheat fields with 80-100 lb/acre nitrate-N (0-24 inch soil profile) or even higher.

Past experience also shows us that drought can create greater crop yield variability across fields. Some zones in the field with better water holding capacity and soil organic matter may have produced a decent crop yield, and these will have lower residual soil nitrate-N. Yet, other zones may have had very poor crop growth and yield, leaving very high amounts of soil nitrate-N remaining.

Zone soil sampling is always a good idea, but it is especially important in drought years. Soil sampling based on productivity zones is the only way to determine the correct amount of nitrogen fertilizer in each zone across the field. To create good productivity zones for soil sampling, it is best to use multiple data layers such as satellite imagery, crop yield maps, topography, or electrical conductivity (Veris or EM38).

This fall, we expect residual soil nitrate-N to be higher than normal, but there will be exceptions to the rule. Last spring, there was a lot of broadcast urea fertilizer applied without incorporation. If no rain was received for several weeks after application, much of the nitrogen could have been lost to ammonia volatilization. This means some fields will seem out of place with lower residual soil nitrate-nitrogen because fertilizer nitrogen was lost last spring.

For fields with more than 150 lb/acre nitrate-N (0-24 inch soil profile), the crop nitrogen requirement for next year may not call for much, if any, nitrogen fertilizer. We must remember that drought creates variability within a field and even within large productivity zones. This is why we always suggest applying a base amount of nitrogen fertilizer to address the variability, even if the soil nitrate test is more than 150 lb/acre nitrate-N. A base nitrogen fertilizer rate (maybe 20 to 40 lb/acre N) should address most of the field variability and provide a fast start to the next year’s crop. In 1988, we learned the tough lesson that applying no nitrogen fertilizer on fields testing very high for nitrate-N was a mistake, and the best producing parts of fields had early-season nitrogen deficiencies. A modest base nitrogen fertilizer rate was the right decision to cover field variability.

Three Simple Lessons from Droughts Past

  1. Soil test all fields for residual soil nitrate-N. There will be considerable variability from field to field and even zone to zone.
  2. The residual soil nitrate-N test allows you to reduce nitrogen fertilizer rates for next year, saving money on crop inputs for 2022.
  3. Remember to apply a modest base nitrogen fertilizer rate on fields testing very high in nitrate-N to address field variability. You will want to get next year’s crop started right.

Phosphorus and the 4Rs: The progress we have made

The year 2019 marked the 350th anniversary of discovering phosphorus, an element required for all life on Earth and an essential plant nutrient in crop production. Over the years, we have fallen in and out of love with phosphorus as a necessary crop input and an unwanted water pollutant. Through improved knowledge and technologies, we have made great progress in phosphorus management in crop production. Let’s take a look at our accomplishments!

Right Rate

Phosphorus fertilizer need and amount is determined through soil testing, based on regionally calibrated soil test levels for each crop. Soils with low soil test phosphorus require more fertilizer to optimize crop production, whereas soils with excess soil test phosphorus may only require a starter rate. Across the upper Midwest and northern Great Plains, soil testing shows that our crops generally need MORE phosphorus to optimize crop yield (Figure 1), particularly as crop yield and crop phosphorus removal in grain has increased. Since plant-available phosphorus varies across any field, precision soil sampling (grid or zone) allows us to vary fertilizer rates to better meet crop phosphorus requirements in different parts of the field.

For phosphorus and the 4Rs article

Figure 1. Soil samples with soil test phosphorus below 15 ppm critical level (Olsen P) across the upper Midwest and northern Great Plains in 2019.

Right Source

Nearly all phosphorus fertilizer materials sold in the upper Midwest and northern Great Plains are some ammoniated phosphate source, which has better plant availability in calcareous soils. Monoammonium phosphate (MAP, 11-52-0) is the most common dry source and convenient as a broadcast or seed-placed fertilizer. Some new phosphate products also include sulfur and micronutrients in the fertilizer granule, helping improve nutrient distribution and handling. The most common fluid source is ammonium polyphosphate (APP, 10-34-0), which usually contains about 75% polyphosphate and 25% orthophosphate that is available for immediate plant uptake. Liquid polyphosphate has the impressive ability to carry 2% zinc in solution, whereas pure orthophosphate can only carry 0.05% zinc. Such fertilizer product synergies help optimize phosphorus and micronutrient use efficiency.

Right Time

Soils of the northern Great Plains are often cold in spring, and early season plant phosphorus uptake can be limited to new seedlings and their small root systems. We apply phosphorus before or at planting to ensure adequate plant-available phosphorus to young plants and foster strong plant development. In-season phosphorus is rarely effective as a preventive or corrective strategy.

Right Place

Proper phosphorus placement depends on your system and goals. Broadcasting phosphorus fertilizer followed by incorporation allows quick application and uniform distribution of high phosphorus rates. This strategy works well if you are building soil test phosphorus in conventional till systems. In no-till systems, broadcast phosphorus without incorporation is not ideal because soluble phosphorus left on the surface can move with runoff to water bodies.

In no-till systems, subsurface banded phosphorus is more popular because phosphorus is placed below the soil surface, thus less vulnerable to runoff losses. In general, banded phosphorus is more efficient than broadcast phosphorus. In the concentrated fertilizer band, less soil reacts with the fertilizer granules, thus reducing phosphorus fixation, allowing improved plant phosphorus uptake. Some planting equipment configurations have the ability to place fertilizer near or with seed, which further optimizes fertilizer placement and timing for young plants.

For more information on 4R phosphorus management, please read this excellent open-access review article: Grant, C.A., and D.N. Flaten. 2019. J. Environ. Qual. 48(5):1356–1369.

5 Things You Should Know About Phosphorus

1. The two accepted soil phosphorus tests in the North Central Region are the Olsen and Bray-P1 methods

The Olsen (bicarbonate) method is the standard soil P test in the North Central region. This method was developed to work on soils with low and high pH. The Olsen method works well in precision soil sampling, where the same field may have zones with acidic and calcareous soils. The Bray P-1 method is another accepted method in our region, but not always recommended. This method was developed in the U.S. Corn Belt, has a long history of soil test calibration studies and works well on acidic soils. The Bray P-1 method fails on soils with pH greater than 7, producing results with false low soil test P. Therefore, it has remained limited to the U.S. Corn Belt proper. The Mehlich-3 method was introduced as a multi-nutrient soil extractant. But like the Bray P-1 method, the acidic Mehlich-3 method does not perform well on calcareous soils; therefore, it has not gained approval by universities in the northern Great Plains and Canadian Prairies.

All soil P test methods are designed to predict the probability of crop response to P fertilization. The methods measure the plant-available P pool. Since the soil test method is an index of availability, the units are reported in parts per million (ppm) and ranked low, medium, or high based on university soil test calibration research. No soil P test method measures the actual pounds of available P in soil, they are only indexes of crop response.

 2. Most soils in the Northern Plains/Canadian Prairies region could use more phosphorus

Soils in the region are naturally low in P and historical P fertilizer use has been low, relative to crop P removal. As a result, many areas in the region still have low soil test P (below soil test critical level of 15 ppm Olsen P) after many decades of crop production. In other words, most farmers are not over-applying P. In fact, soils with low soil test P should receive moderate to high rates of fertilizer P each year to achieve good crop yield and maximize profitability.

Figure 1. Map developed using AGVISE soil test data. AGVISE has created regional summaries like this for the past 40 years. Check out the summary data for Montana and Canada and summaries of other nutrients and soil properties here.

3. You should use starter phosphorus fertilizer

Starter fertilizer placed near, or with the seed, is critical for crops like corn and wheat, regardless of soil test P level. A P fertilizer band placed near the seed will ensure soluble P near developing plant roots and results in vigorous early season growth, which is important in cold, wet soil conditions. Placing P fertilizer in bands also improves P use efficiency, especially in soils with relatively low or high pH. Phosphorus availability is greatest near soil pH 6.5. Since changing soil pH is difficult and costly, fertilizer P use efficiency is more easily improved with application in fertilizer bands to reduce the volume of soil involved in P fixation reactions.

4. Phosphorus source doesn’t really matter

No matter the starting material, all P fertilizers go through the same chemical reactions in the soil. It does not matter if the fertilizer starts as a poly-phosphate or ortho-phosphate. Within about one week in the soil, all P fertilizer sources react to form lower solubility compounds. What is more important than source is the placement of the fertilizer to increase availability (banding) and the rate of actual P fertilizer applied.

5. Phosphorus can be an environmental concern

Phosphorus entering surface waters can create algae blooms and fish kills. Since P is not mobile in soil, the P leaching risk is very low. However, P does move to surface waters with soil particles when erosion occurs. In cold climates like those on the northern Great Plains and Canadian Prairies, dissolved P released from vegetation can move with snow melt to surface water.

For more information about phosphorus and its reactions in soil, explore the links below:

Understanding Phosphorus in Minnesota Soils (Univ. Minnesota)

Understanding Plant Nutrients: Soil and Applied Phosphorus (Univ. Wisconsin)

Phosphorus Facts: Soil, plant, and fertilizer (Kansas State Univ.)