Switching More Acres to Soybean?

The spike in nitrogen fertilizer prices over the past month has prompted many growers to think about switching more acres to soybean in 2026. The high nitrogen fertilizer prices are squeezing the potential profitability of any crop requiring nitrogen fertilizer, such as corn, dry bean, canola, or wheat. The symbiotic nitrogen fixing behavior of soybean is an impressive feat of nature that helps reduce nitrogen fertilizer expenses in farm budgets.

If you do plan to plant more soybean acres in 2026, remember that soybean still has its own crop nutrient needs and removal, like phosphorus and potassium, that cannot be ignored for the soybean crop or across the crop rotation. In addition, iron deficiency chlorosis (IDC) is a common problem in soybean fields across the region, and soybean cyst nematode (SCN) can debilitate and cripple soybean yield now and into the future.

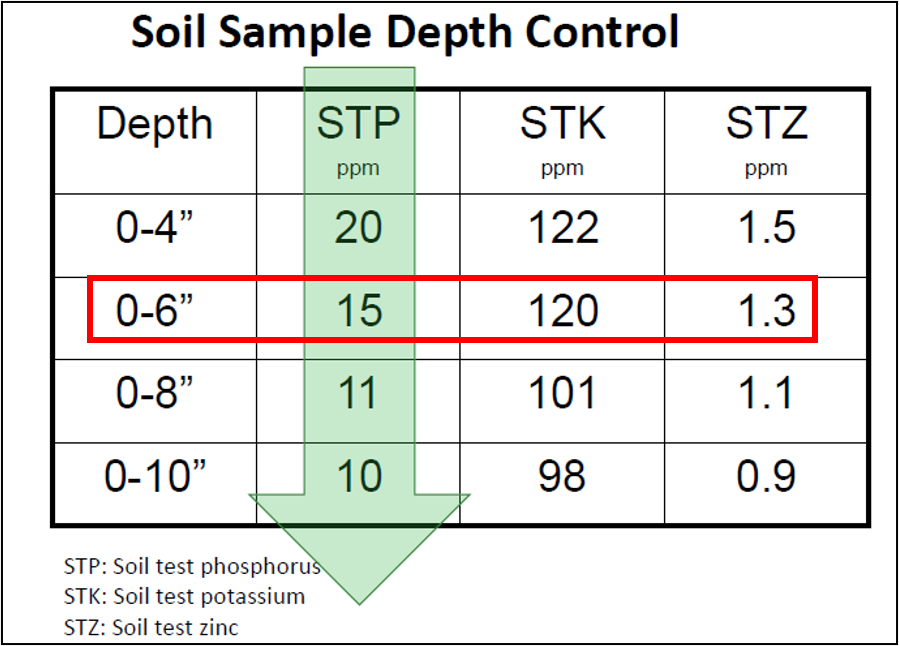
Before you plant soybean on any acre, it is important to have current soil test information for IDC and SCN. These two problems are best managed with the right soybean variety, and there is a nice window before spring planting to collect soil samples.

Soybean Fertility (Phosphorus and Potassium)

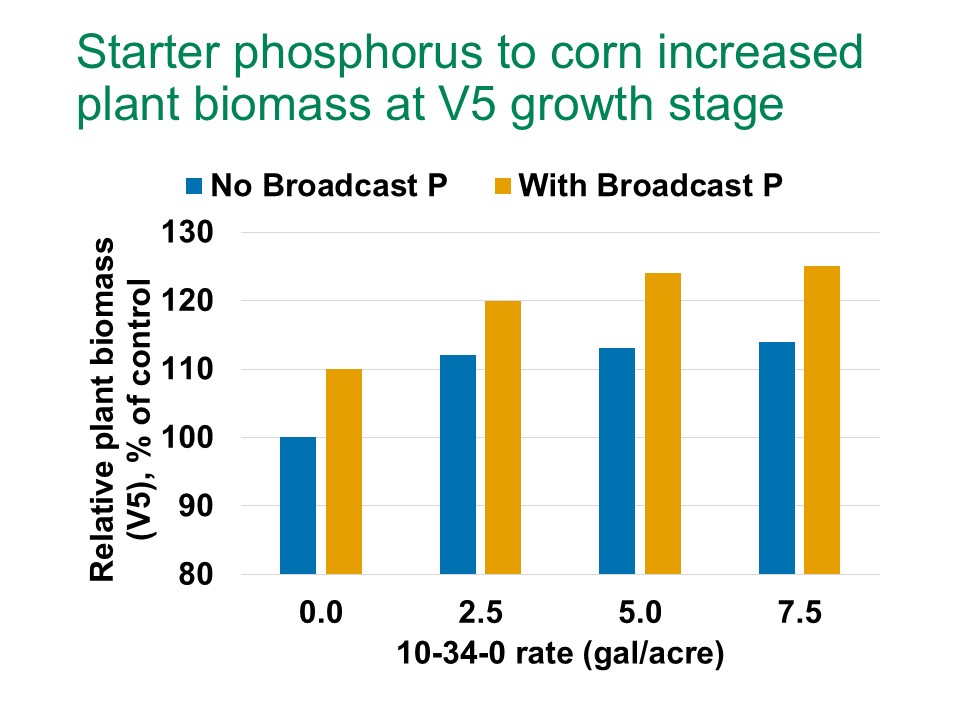
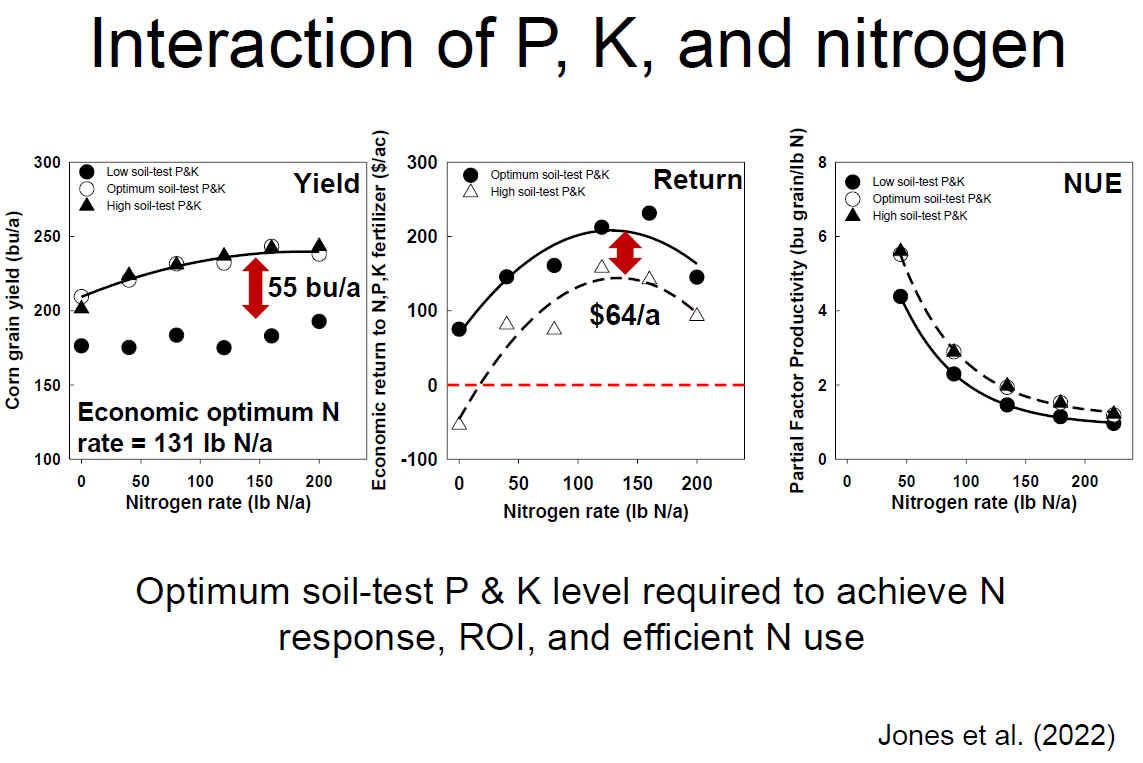
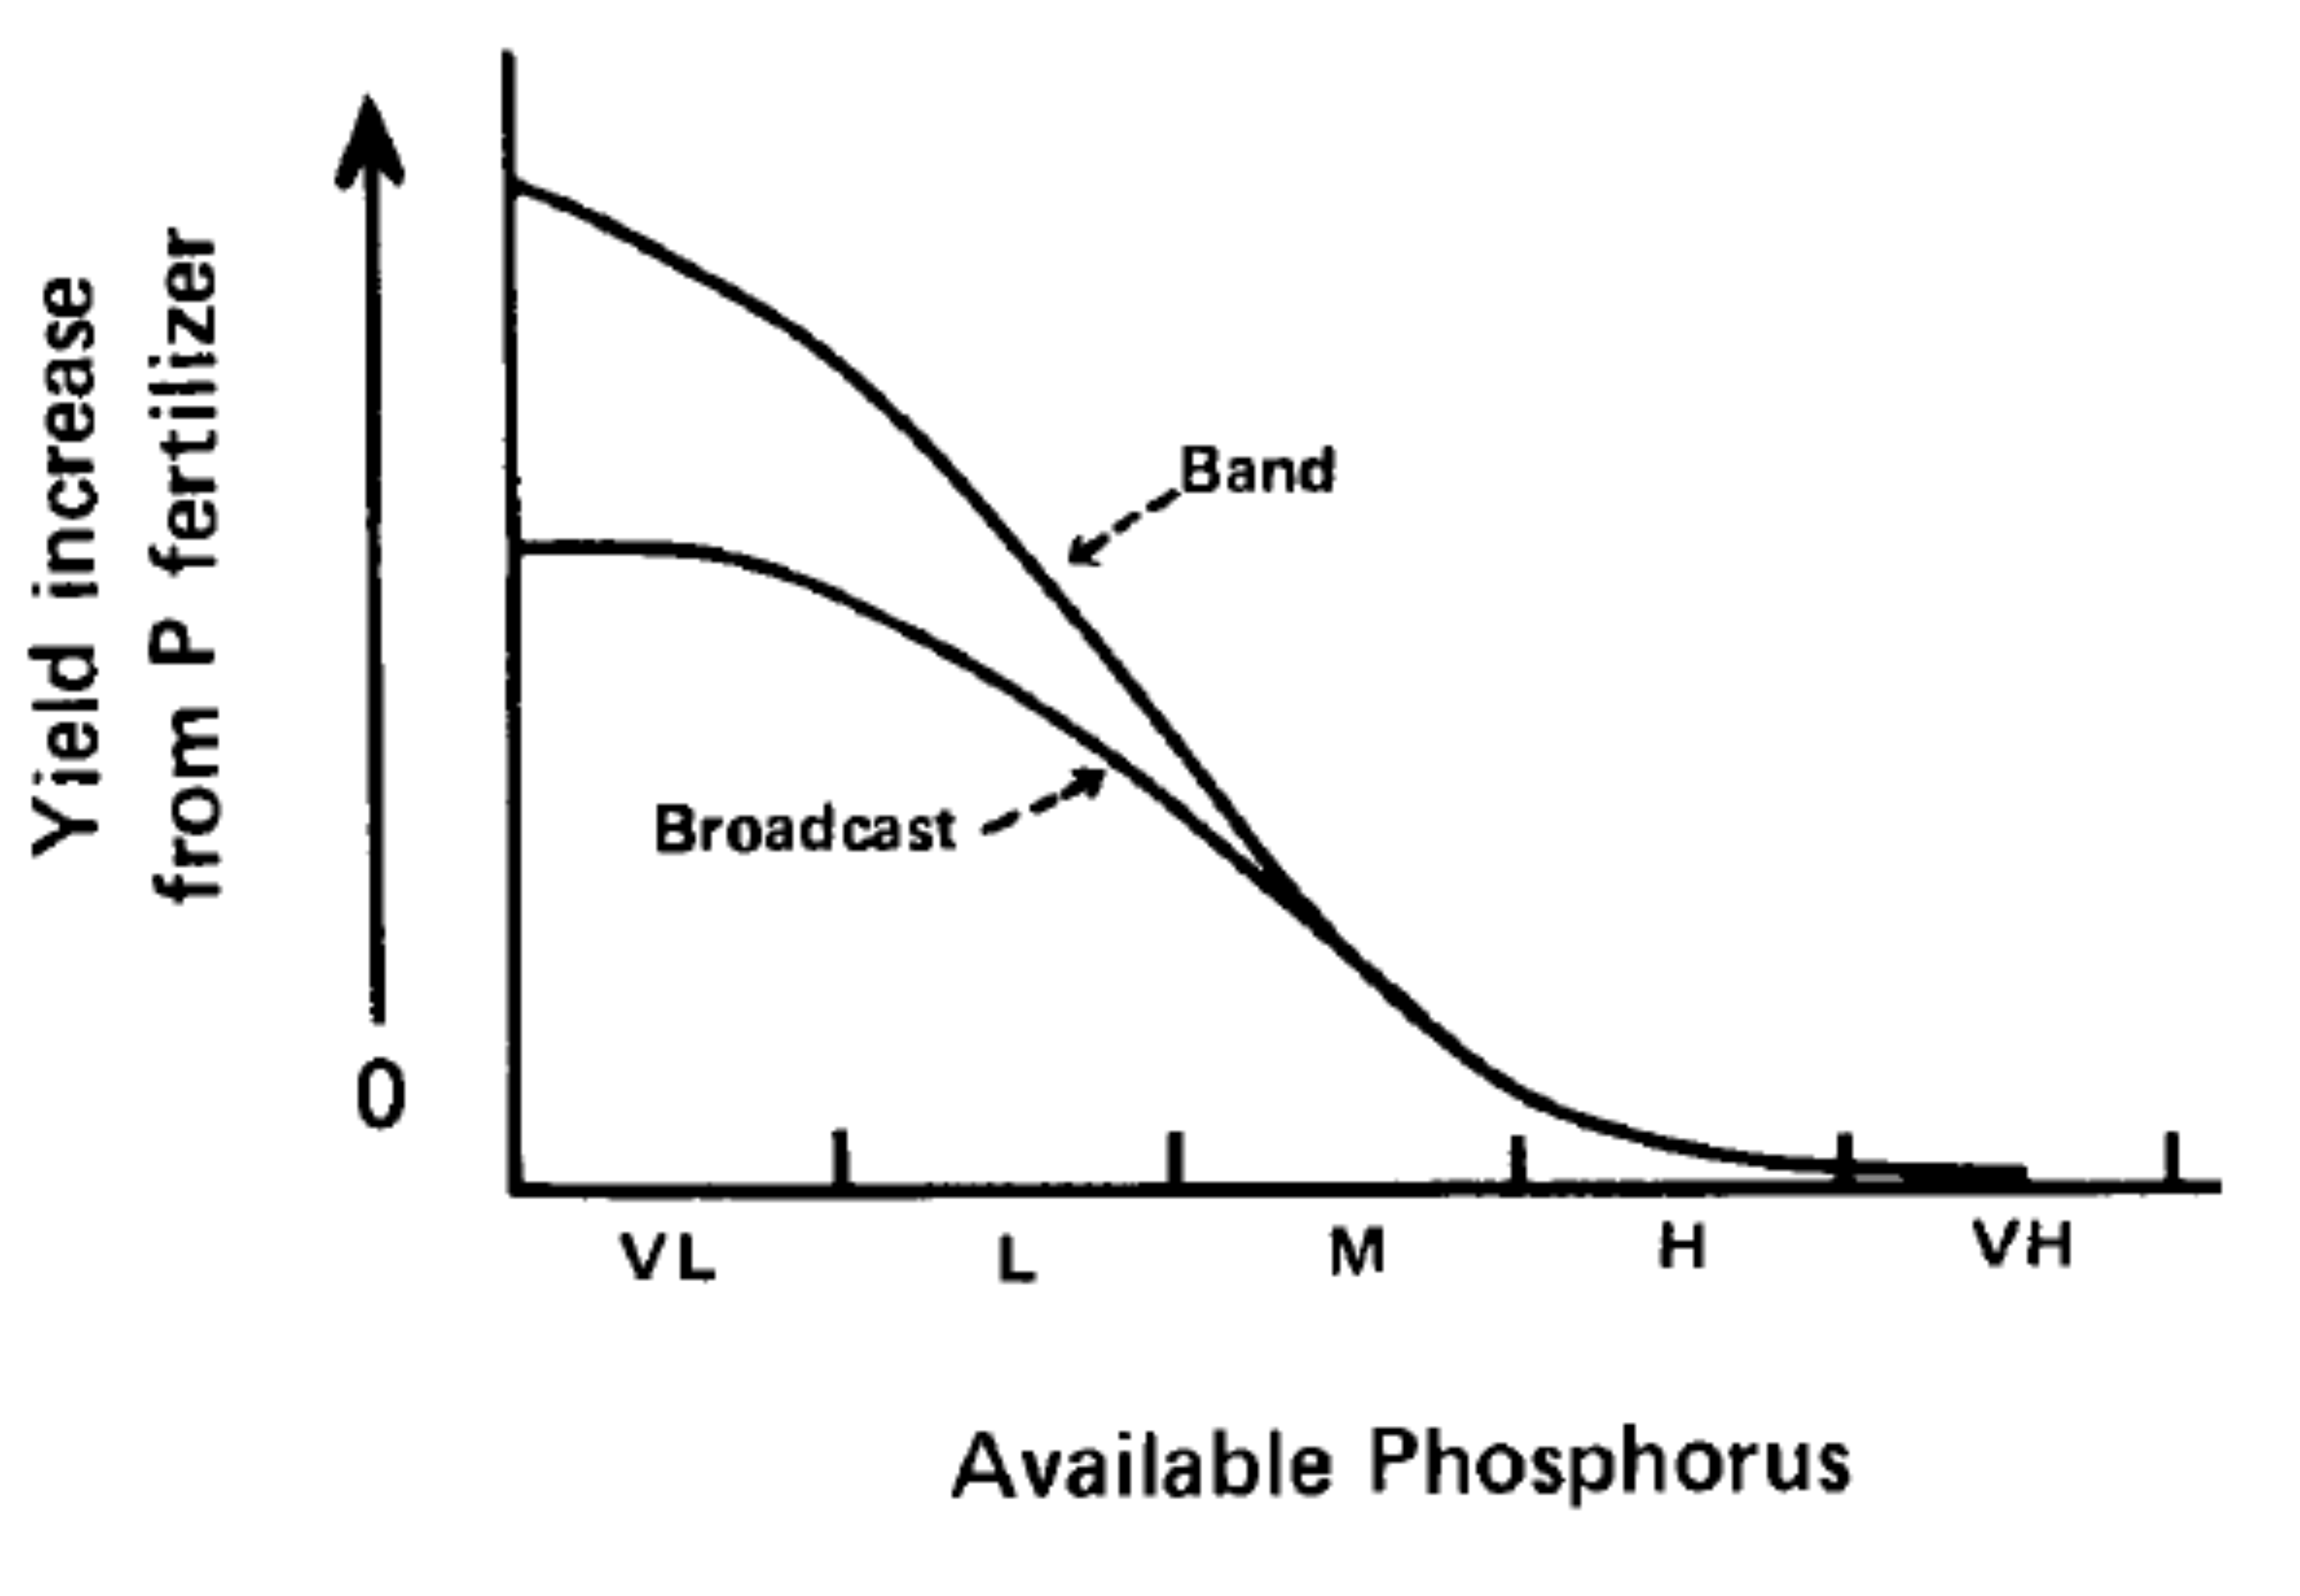
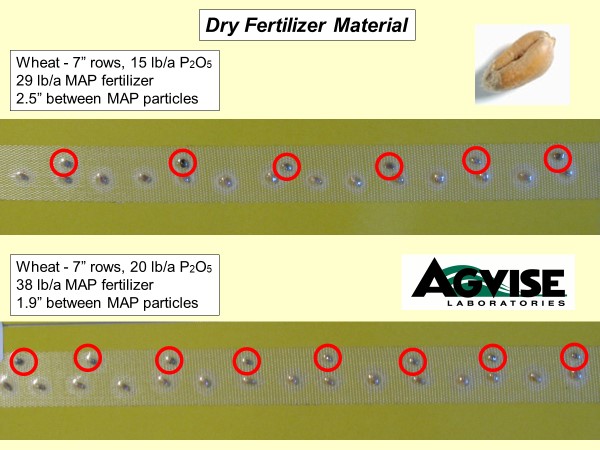
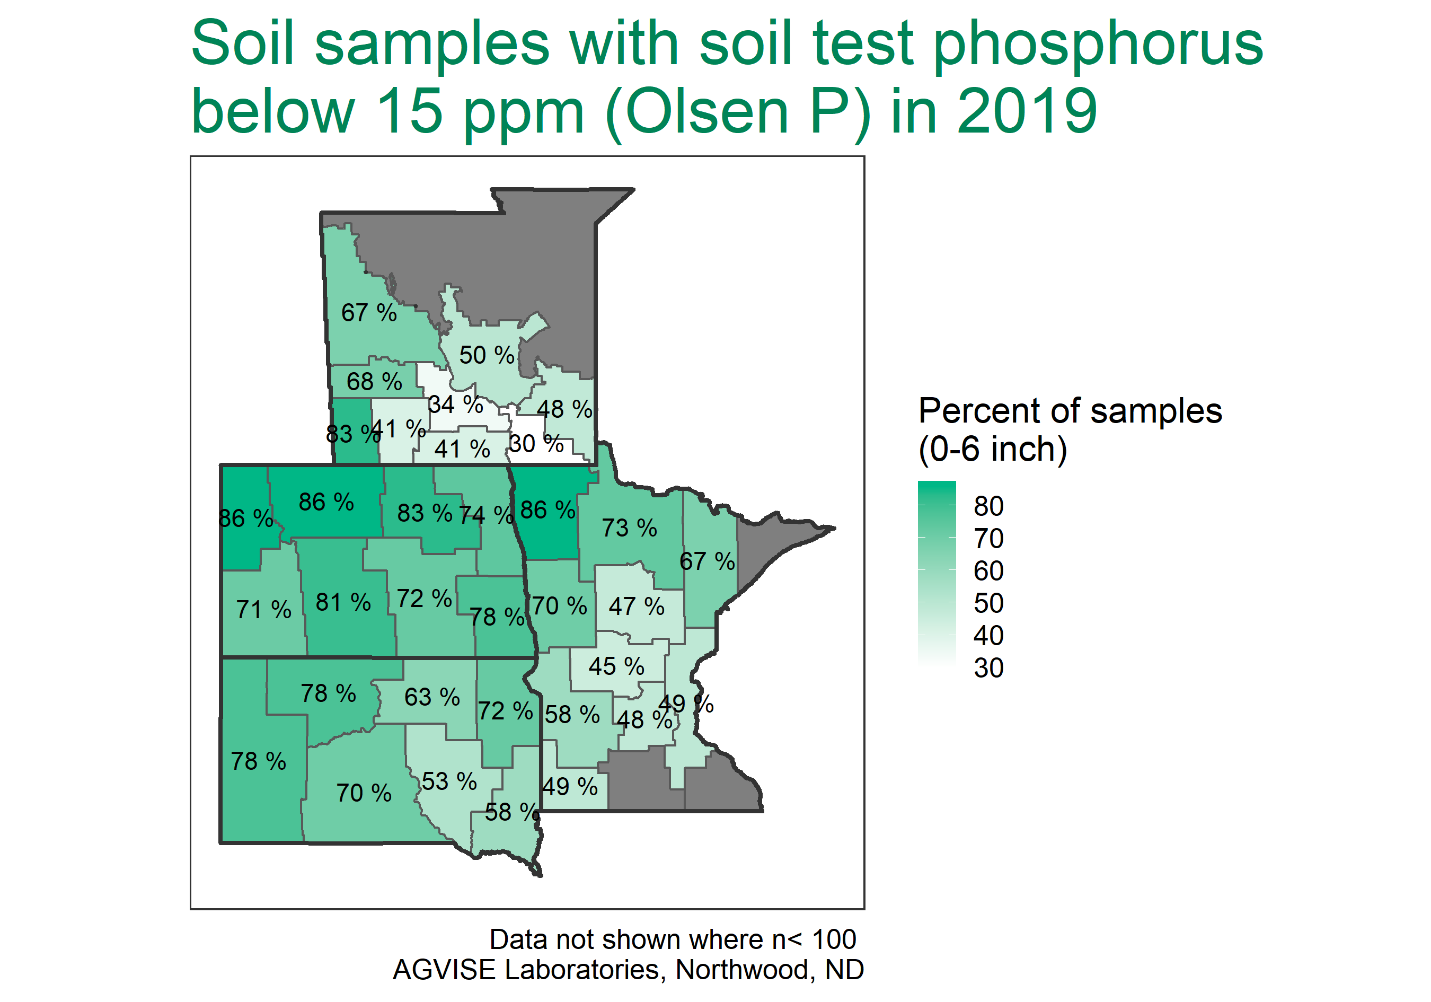
Soybean does not respond to phosphorus as dramatically as grass crops like corn or wheat do. Nevertheless, medium to high soil test P is required to achieve good soybean yields. Soybean responds to broadcast P placement better than seed-placed P or sideband P. In no-till regions where soybean is often planted with air drills, seed-placed P or sideband P is often the only opportunity to apply phosphorus in the system. You must pay special attention to seed-placed fertilizer safety with soybean.

Soybean removes far more potassium in harvested seed than canola or wheat. Soybean yielding 50 bu/acre removes about 60 lb/acre K2O, while wheat yielding 80 bu/acre removes only 25 lb/acre K2O. Pay close attention to potassium removal across the crop rotation. After soybean is added to the crop rotation, cumulative crop K removal over numerous years increases greatly, and declining soil test K is observed over time.

Do not place potassium fertilizer with soybean seed; delayed seedling emergence and reduced plant population can occur. Any potassium fertilizer should be broadcasted or banded away from seed.

Soybean Iron Deficiency Chlorosis (IDC)

Soybean is very susceptible to iron deficiency chlorosis (IDC). Soybean IDC is not caused by low soil iron but instead by soil conditions that decrease iron availability and uptake by soybean roots. Soybean IDC risk and severity are primarily related to soil carbonate content (calcium carbonate equivalent, CCE) and worsened by salinity (electrical conductivity, EC). These primary risk factors (carbonate and salinity) can be measured with routine soil testing.

Soybean IDC is common in the upper Midwest, northern Great Plains, and Canadian Prairies, where soils frequently have high carbonate and/or salinity. Within a field, IDC symptoms are usually confined to soybean IDC hotspots with high carbonate and salinity; however, symptoms may appear across a field if high carbonate and salinity are present throughout the field. Soybean IDC severity is made worse in cool, wet soils and soils with high residual nitrate-N. Soil pH alone is not a good indicator of soybean IDC risk because some high pH soils lack high carbonate and salinity, which are the two principal risk factors.

Guidelines for managing soybean IDC

  1. Soil test each field, zone, or grid for soil carbonate and salinity. This may require soil sampling prior to soybean (possibly outside of your usual soil sampling rotation), or consult previous soil test records.
  2. Plant soybean in fields with low carbonate and salinity (principal soybean IDC risk factors).
  3. Choose an IDC tolerant soybean variety on fields with moderate to high carbonate and salinity. This is your most practical option to reduce soybean IDC risk. Consult seed dealers, university soybean IDC ratings, and neighbor experiences when searching for IDC tolerant soybean varieties.
  4. Plant soybean in wider rows. Soybean IDC tends to be less severe in wide-row spacings (more plants per row, plants are closer together) than narrow-row spacings or solid-seeded spacings.
  5. Apply chelated iron fertilizer (high-quality FeEDDHA or FeHBED) in-furrow at planting. In-furrow iron fertilizer application may not be enough to help an IDC susceptible variety in high IDC risk soils (see points #2 and #3).
  6. Avoid planting soybean on soils with very high IDC risk.

Soybean Cyst Nematode (SCN)

Soybean cyst nematode (SCN) is the #1 pathogen causing soybean yield loss in the United States. It is a microscopic parasitic worm that lives in soil and attacks the roots of susceptible soybean and dry bean varieties. Soybean cyst nematode is found across the soybean-growing regions of the United States; it first reached Manitoba in 2019.

Soybean cyst nematode is best managed with crop rotation and SCN-resistant soybean varieties. Soil sampling for SCN is your best tool to learn if you have SCN and also if the SCN resistance traits in your soybean varieties are still working. In recent years, AGVISE Laboratories has documented failing SCN control with PI8878 resistance (most common type) and a continuing increase in SCN egg counts across the region. In some places, the SCN egg counts are so high that no soybean crop (resistant or not) should be planted for multiple years. Once you have it, SCN is nearly impossible to eliminate from fields. A current SCN soil sample will help you choose the right SCN-resistant soybean variety and manage SCN populations now and into the future.

Phosphorus Fertilizer Forms: Orthophosphate or Polyphosphate (Ortho-P or Poly-P)

This article originally appeared in the AGVISE Laboratories Spring 2024 Newsletter.

Each spring, we get questions about what form of phosphate fertilizer is better. The debate over orthophosphate and polyphosphate has raged for decades. Just when we think we have put the issue to bed, it comes up again! These questions originate from the simple fact that orthophosphate (ortho-P) is the form that plant roots are able to uptake. This simple fact, however, is a simplistic understanding of phosphorus fertilizer forms and chemistry in soil. The truth is either form of phosphate fertilizer form (ortho-P or poly-P) will provide the same crop yield response when applied at the same rate of phosphorus. With “new” fertilizer products and additives on the market, it is time to revisit the basics of phosphorus fertilizer materials and their behavior in soil.

All dry phosphate fertilizers are orthophosphate forms; this includes monoammonium phosphate (MAP, 11-52-0), diammonium phosphate (18-46-0), and triple superphosphate (TSP, 0-46-0). Yes, this means that all dry phosphate fertilizers are orthophosphate forms. Liquid phosphate fertilizers are usually some blend of orthophosphate and polyphosphate of varying proportions. There are pure liquid ortho-P fertilizers available, but the liquid poly-P fertilizers will also contain some smaller proportion of ortho-P in solution too. Either way, all phosphorus fertilizer materials, dry or liquid, ortho-P or poly-P, will act the same once applied to soil.

In fertilizer manufacturing, all products start as phosphoric acid derived from rock phosphate. You could use liquid phosphoric acid as a phosphorus fertilizer material itself, but it is corrosive and difficult to handle. The next step is converting phosphoric acid to a more stable product that is easier to handle. If you want to make a high concentration liquid phosphorus fertilizer, you must also remove some water from the phosphoric acidic. The dehydration process (removal of water) produces linked chains of orthophosphate, which are called polyphosphate chains, resulting in a denser and more concentrated liquid phosphate material. The name “polyphosphate” literally means “many phosphate.” The dehydration process is never 100% efficient, so some orthophosphate always remains in solution. In most polyphosphate fertilizers, like 10-34-0, the breakdown is around 75% polyphosphate and 25% orthophosphate. This results in a higher concentration liquid phosphorus fertilizer with more pounds of phosphorus per gallon, meaning that you have to haul less material to the field to achieve the same phosphorus rate.

As a fertilizer applied to soil, does this mean polyphosphate is less available than orthophosphate to plant roots? When polyphosphate is applied to soil, the fertilizer reacts quickly with water in soil and breaks into orthophosphate again. The “many phosphate” becomes normal orthophosphate again, and the rehydration step is very fast. Even at cool soil temperatures (40 deg F), over 40% of polyphosphate converts to orthophosphate within 72 hours. Within one to two weeks, the conversion is complete, leaving all plant-available orthophosphate for crop uptake.

In the end, it all comes back to crop yield, right? In studies across the Midwest, Great Plains, and Canadian Prairies, the performance of orthophosphate and polyphosphate have been equal, as long as you apply the same rate of phosphorus. As stated earlier, all phosphorus fertilizer materials, dry or liquid, ortho-P or poly-P, will act the same once applied to soil.

BONUS A unique property of ammonium polyphosphate (APP, 10-34-0) is the ability to chelate or sequester metal cations, such as micronutrients like zinc, in the polyphosphate molecule. This allows polyphosphate solutions to maintain a higher concentration of micronutrients in solution than pure orthophosphate. Ammonium polyphosphate can maintain 2% Zn in solution, compared to only 0.05% Zn with pure orthophosphate.

Start Strong, Finish Strong with Starter Phosphorus

This article originally appeared in the AGVISE Laboratories Spring 2025 Newsletter.

Cool and wet soil conditions can limit root growth and phosphorus uptake during the early growing growing season. This is why starter phosphorus placed with or near the seed can be so effective in enhancing early plant growth and development. In small grains, starter phosphorus helps improve tiller initiation, even on soil with high soil test P. Faster development in spring can also help flowering wheat or canola beat the summer heat, or advance the corn silking date and maturity to help save grain drying expenses in fall.

Research at the University of Minnesota has found that starter phosphorus applied to corn can promote 10-15% more early season corn biomass and advance corn silking date by 1-2 days, across a range of planting dates and hybrid maturities. This can be achieved with starter phosphorus rates as low as 2.5 gal/acre 10-34-0. It is important to choose a phosphorus source and rate that can provide at least 10 lb/acre P2O5 with or near the seed. There are many phosphorus products available. Liquid orthophosphate and polyphosphate sources are equally effective at supplying phosphorus (in spite of what you may read in marketing materials). Compare products based on the cost per total amount of phosphorus applied; simply multiply the phosphorus content (% P2O5), product density (lb/gal), and intended application rate to calculate the total phosphorus rate in lb/acre P2O5.

Starter phosphorus increased early corn plant biomass (growth stage V5) when applied as 10-34-0 with seed, with and without broadcast phosphorus fertilizer. Summarized across multiple soils with pH ranges including 6.0 to 8.5. Reference: Kaiser, D.E, and J.A. Lamb. 2023. Banding fertilizer with corn seed. UMN Ext. Circ., Univ. Minnesota, St. Paul, MN. https://extension.umn.edu/crop-specific-needs/banding-fertilizer-corn-seed

Choosing the Right Phosphorus Method

This article originally appeared in the AGVISE Laboratories Spring 2023 Newsletter under President’s Corner

The phosphorus soil test debate never ends. Should I use the Olsen test, or maybe Bray-1 would be better? What about the Mehlich-3 method, and should that extract be analyzed on an ICP or with a colorimetric method? Perhaps, Bray-2 or the Haney extractable P is something to consider? This whole phosphorus test dilemma can be quite confusing; however, the answer is quite simple. Use the soil phosphorus test that is calibrated for your region!

In the upper Midwest, the Olsen test is the most reliable method to determine phosphorus availability and has the most correlation and calibration data with field trials. Many hours have been spent by university researchers putting out field trials to determine phosphorus fertilizer rates for various crops. The researchers have evaluated various phosphorus methods, and the two most common methods are the Bray-1 and Olsen extractants. The Bray-1 method is the older method, developed in Illinois. It works well on soils with pH below 7.3. Once the soil pH is above 7.3, the extractant may fail. If the test fails, it will produce a result near zero.

The Olsen method is required on calcareous soils (pH > 7.3), but it also works well on acidic soils. There is a common misconception that the Olsen method is only suitable on calcareous soils. In fact, the Olsen method is widely used across the world because of its versatility on acidic and calcareous soils. It is a perfect fit for our region because it works so well across a wide soil pH range and on diverse soil types. In the AGVISE Newsletter Spring 2017 issue, retired AGVISE President Robert Deutsch compiled soil test data for the Bray-1 and Olsen methods with over 25,000 soil samples. The graphs highlight how robust the Olsen phosphorus method is, working on acidic and calcareous soils alike.

The Mehlich-3 method has gained popularity in the southeast United States and the central Midwest. In these regions, the soils are more weathered and often do not have problems with high calcium carbonate content. At the University of Minnesota, Dr. Dan Kaiser has worked on Mehlich-3 method correlation on Minnesota soils for quite a few years. For some soils, the Mehlich-3 method performed as expected, while some others had Mehlich-3 results 8 to 10 times higher than expected. For these reasons, the Mehlich-3 method has not been approved for use in the upper Midwest or northern Great Plains.

As of this time the only phosphorus soil tests recommended for soils in the upper Midwest are the Olsen and Bray-1 extracts. If someone mentions using any other phosphorus soil test, it has not been tested or correlated to the soils in this region.

Two Graphics You Should Know Before the 2023 Growing Season

This article originally appeared in the AGVISE Laboratories Spring 2023 Newsletter

The goal of AGVISE Newsletters is to inform you and your customers of important soil fertility information relevant to our area. Often, visuals or graphs are much more powerful at communicating a message than words. With that in mind, I want to share two figures I think you should know about going into the 2023 growing season with a short synopsis and where you can find more information on the topic.

Adapted from the “Biostimulants” episode of the University of Minnesota Extension Nutrient Management Podcast https://nutrientmanagement.transistor.fm/episodes/biostimulants-52305fc9-6c01-4907-8507-2bcf4c708a08

Right now, there are many biological products and fertilizer additives on the market. In particular, asymbiotic nitrogen-fixing products have gained a lot of attention, but many have little or no university research evaluating them. Any grower wanting to try new products should test them on a small acreage first, before adopting them across the whole farm. To the left is a diagram of how such an on-farm trial would look. The key factors of a meaningful on-farm trial include a control treatment (the standard practice), the standard practice plus the product, and randomized replication (at least three replicates, randomized so that one treatment is not always on the east or west side of the trial area).

If the standard nitrogen rate will be reduced when the product is used, a treatment should also be included that compares the same reduced nitrogen rate without the product (this three-treatment setup is what is pictured). If the standard nitrogen rate is higher than the crop N requirement, maybe if you do not have a current soil nitrate-N test or just general overapplication, a reduced nitrogen rate plus the product that produces the same crop yield as the standard practice does not mean that the product is producing additional nitrogen for the crop; it may just mean that the grower can cut back their standard nitrogen rate.

Slide from Dr. John Jones’ 2023 AGVISE Seminar presentation, Phosphorus and Potassium: A Fresh Look with Fresh Data https://www.agvise.com/resources/seminars-and-events/

With fertilizer prices remaining high, it is tempting to cut back phosphorus and potassium inputs to save money. As tempting as this is, do not cut back farther than the fertilizer rates needed to meet the critical soil test level, as optimum soil-test P and K levels are required to achieve the highest response from nitrogen fertilizer. While working to update the Wisconsin phosphorus and potassium fertilizer guidelines, Dr. John Jones at the University of Wisconsin has put together some excellent data illustrating the reality of Liebig’s Law of the Minimum: when P and K fertility needs are unmet, the return from nitrogen fertilizer investment will be reduced compared to when P and K are at optimum levels. This means pouring on more nitrogen will not increase crop yield unless you are doing a good job of managing P and K too. Although not shown here, Dr. Jones also has data showing that corn and soybean yield response to P is reduced when K fertility needs are unmet.

High Fertilizer Prices? Using Crop Removal P & K Rates is an Expensive Choice

This article originally appeared in the AGVISE Laboratories Spring 2023 Newsletter

If you thought high fertilizer prices would resolve after one or two years, it is looking like those prices are becoming the new norm. At such prices, every fertilizer dollar you spend must be spent to guarantee the best bang for each buck. This means soil testing makes more dollars and sense than ever.

Phosphorus and potassium are best managed with current soil test information to maximize crop yield potential and profitability. Yet, some people continue to apply phosphorus and potassium at crop removal (CR) rates as a way to maintain the soil fertility status quo. This is a major oversight because CR-based rates maintain soil fertility in a way that overapplies fertilizer to parts of the field with high soil test P or K that do not need more fertilizer, yet underapplies fertilizer to parts with low soil test P or K and ultimately sacrifices crop yield. This is particularly troublesome if the factor that limited crop yield was one of those nutrients! As a result, the reduced crop yield leads to a lower CR-based fertilizer rate that fails to fix the soil fertility issue, and you stay in a low soil fertility rut. For example, if soil test P is very low and limits crop yield, a crop removal-based P rate will undershoot the actual crop P requirement, resulting in reduced crop yield and continued nutrient mining year after year. A soil test-based P rate will show you exactly where more fertilizer is required to maximize crop yield and where you can reduce fertilizer rates to maximize profitability.

Another serious reason to avoid CR-based rates is the risk of off-site nutrient losses, especially phosphorus. When CR-based rates are applied on soils with high or very high soil test P, this increases the risk for environmental P loss to waterways that can degrade water quality and result in regulatory oversight. Precision soil sampling (grid or zone) and soil test-based fertilizer rates is the best way to maximize crop yield, profitability, and protect the environment.

Banding Phosphorus and Potassium: Stretch your fertilizer dollars further

This article originally appeared in the AGVISE Laboratories Winter 2022 Newsletter

Broadcast or band? For phosphorus and potassium, these are big fertilizer questions. In recent months, high fertilizer prices have prompted farmers and agronomists to consider other strategies to reduce fertilizer costs without jeopardizing crop yield. Among the most common and effective options is placing fertilizer in a tight band below the soil surface, also known as a subsurface band.

Subsurface banding helps improve fertilizer recovery and efficiency. It ensures that fertilizer is placed in the plant root zone, facilitating direct uptake of crop nutrients. It also minimizes potential fixation reactions (aka tie-up) that reduce soil nutrient availability, allowing more phosphorus or potassium to remain available in soil for plant uptake. You ultimately get more bang for your buck on each pound of fertilizer applied. In addition, placing fertilizer below the soil surface protects fertilizer from

Idealized crop response to phosphorus as affected by fertilizer placement and soil test level (figure from J. Prod. Agric. 1:70-79).

soil erosion and runoff losses via wind and water. This is important for fall-applied phosphorus and potassium because spring snowmelt runoff and wind erosion can move fertilizer lying on the soil surface from neighbor to neighbor and watersheds beyond.

When we discuss banding phosphorus and potassium, it also comes along with the question, “How far can I cut fertilizer rates?” It is important to recognize that the improved efficiency of banding over broadcast is a function of soil test levels (figure) and proximity to the seed row. If you have high soil test levels (>15 ppm Olsen P), then the expected crop yield response to fertilizer, whether broadcast or banded, is lower. Banding fertilizer still helps with the fertilizer recovery, but the expected crop yield increase is often similar to broadcast. However, if you have low soil test levels, then the expected crop yield response is much greater with banding.

Where does seed row proximity fit in? The greatest efficiency comes with in-furrow or near-seed placement (e.g. 2×2 band), allowing effective fertilizer rates of one-half to two-thirds their broadcast equivalent. The near-seed placement also provides the starter effect, which enhances early plant growth and development in cool, wet soils of the upper Midwest and northern Great Plains. Of course, you must watch seed safety with any seed-placed fertilizer in the furrow.

For deep-band or mid-row band placement, the benefits over broadcast begin to disappear. These are still great placement options for anhydrous ammonia or urea, but the greater distance between the seed row and fertilizer band does not provide the same efficiency for immobile soil nutrients like phosphorus and potassium. This will surprise some people hoping that strip-till with deep-banded phosphorus and potassium or a one-pass air seeder with mid-row banders might be their answer to reducing fertilizer costs. For these “far-from-seed” banding options, reduced fertilizer rates are not suggested, and some in-furrow or near-seed banded fertilizer should still be applied for the current crop.


Soil Sample Before Tillage: Consistent sample depth matters!

The fall harvest season is a busy time of year. Farmers need to finish harvest, apply fertilizer, and complete any tillage operations before the long winter sets in. Another field operation that needs to be completed within this flurry of activity is soil sampling, and sampling timing is crucial to getting quality and consistent soil cores.

Do your best to soil sample fields before any tillage pass. Tillage makes collecting soil cores with consistent depths very difficult, which can affect test results. Soil test results are only as reliable as the soil samples that were collected from the field. If a sample is submitted as a 0 to 6-inch sample and is only really the top 0 to 4-inch of the soil, soil test values are inflated compared to actual 0 to 6-inch results. The opposite happens if a core is actually deeper than the 0 to 6-inch depth: soil test values are diluted if the sample that was submitted is deeper. The table below shows an example of how test levels of non-mobile nutrients like P, K, and Zn decrease as soil core length increases.

Why tillage affects sampling depth consistency and core quality

Tillage breaks apart soil and introduces air, essentially “fluffing” the soil. Sampling after the soil has been “fluffed” means the sampler has to guess what actually represents a 6-inch soil depth for that field. What was a 0 to 6-inch core in the soil probe before tillage might actually take up 8 inches in the soil probe now, given the soil profile is now “fluffy” after tillage. Over time the soil will settle, but when does that happen? How fast does that happen? When will 0 to 6 inches of tilled soil in the soil probe actually represent a 0 to 6-inch depth again? No one can accurately answer these questions.

Beyond the soil being “fluffy” after tillage, tillage loosens soil aggregates, makes clods, and generally dries the soil. This means loose soil may fall out of the probe or the probe pushes around the clods at the surface and does not get a true 0 to 6-inch sample. This might mean a core that’s collected and sent to the laboratory might actually be a 2 to 8-inch depth core, or a 2 to 6-inch depth core.

A tip for sampling after tillage

If you have to sample after tillage, sample in the wheel track. The tire compresses the soil and allows you to get a better opportunity at a true 0 to 6-soil core depth.

Getting consistent soil core depths is crucial. Sampling before tillage is the best thing you can do to ensure quality cores with consistent depths. Sampling after tillage can result in lower test levels for non-mobile nutrients like P, K, and Zn. Please call either AGVISE laboratory and ask for one of our technical support staff if you have any questions about sampling after a field has been tilled. 

Starter Fertilizer Display: How low can YOU go?

When profits are squeezed, more farmers are asking about optimal starter fertilizer rates and how low starter fertilizer rates can be. These questions are the result of wanting to keep fertilizer costs down, to plant as many acres per day as possible, and to take advantage of more efficient, lower rates of banded phosphorus fertilizer compared to higher rates of broadcast phosphorus fertilizer.

To illustrate the role of starter fertilizer rates and seed placement, we put together displays showing the distance between fertilizer granules or droplets at various rates and row spacings. You can see several pictures with canola, corn, soybean, sugar beet, and wheat. We greatly thank John Heard with Manitoba Agriculture for helping with the displays.

The displays show the normal seed spacing for several crops with different dry or liquid fertilizer rates alongside the seed. These displays help visualize the distance between the seed and fertilizer at several rates. University research shows that to achieve the full starter effect, a fertilizer granule or droplet must be within 1.5-2.0 inches of each seed. If the fertilizer granule or droplet is more than 1.5-2.0 inches away from the seed, the starter effect is lost. Some people wonder about these displays, but you can prove it to yourself pretty easily. Just run the planter partially down on a hard surface at normal planting speed. You will see what you imagine as a constant stream of liquid fertilizer, ends up being individual droplets at normal speed, especially with narrow row spacings and lower fertilizer rates.

These displays help illustrate the minimum starter fertilizer rate to maintain fertilizer placement within 1.5-2.0 inches of each seed for the full starter effect. In addition to an adequate starter fertilizer rate, additional phosphorus and potassium should be applied to prevent nutrient mining, causing soil test levels to decline in years when minimum fertilizer rates are applied.

Phosphorus and the 4Rs: The progress we have made

The year 2019 marked the 350th anniversary of discovering phosphorus, an element required for all life on Earth and an essential plant nutrient in crop production. Over the years, we have fallen in and out of love with phosphorus as a necessary crop input and an unwanted water pollutant. Through improved knowledge and technologies, we have made great progress in phosphorus management in crop production. Let’s take a look at our accomplishments!

Right Rate

Phosphorus fertilizer need and amount is determined through soil testing, based on regionally calibrated soil test levels for each crop. Soils with low soil test phosphorus require more fertilizer to optimize crop production, whereas soils with excess soil test phosphorus may only require a starter rate. Across the upper Midwest and northern Great Plains, soil testing shows that our crops generally need MORE phosphorus to optimize crop yield (Figure 1), particularly as crop yield and crop phosphorus removal in grain has increased. Since plant-available phosphorus varies across any field, precision soil sampling (grid or zone) allows us to vary fertilizer rates to better meet crop phosphorus requirements in different parts of the field.

For phosphorus and the 4Rs article

Figure 1. Soil samples with soil test phosphorus below 15 ppm critical level (Olsen P) across the upper Midwest and northern Great Plains in 2019.

Right Source

Nearly all phosphorus fertilizer materials sold in the upper Midwest and northern Great Plains are some ammoniated phosphate source, which has better plant availability in calcareous soils. Monoammonium phosphate (MAP, 11-52-0) is the most common dry source and convenient as a broadcast or seed-placed fertilizer. Some new phosphate products also include sulfur and micronutrients in the fertilizer granule, helping improve nutrient distribution and handling. The most common fluid source is ammonium polyphosphate (APP, 10-34-0), which usually contains about 75% polyphosphate and 25% orthophosphate that is available for immediate plant uptake. Liquid polyphosphate has the impressive ability to carry 2% zinc in solution, whereas pure orthophosphate can only carry 0.05% zinc. Such fertilizer product synergies help optimize phosphorus and micronutrient use efficiency.

Right Time

Soils of the northern Great Plains are often cold in spring, and early season plant phosphorus uptake can be limited to new seedlings and their small root systems. We apply phosphorus before or at planting to ensure adequate plant-available phosphorus to young plants and foster strong plant development. In-season phosphorus is rarely effective as a preventive or corrective strategy.

Right Place

Proper phosphorus placement depends on your system and goals. Broadcasting phosphorus fertilizer followed by incorporation allows quick application and uniform distribution of high phosphorus rates. This strategy works well if you are building soil test phosphorus in conventional till systems. In no-till systems, broadcast phosphorus without incorporation is not ideal because soluble phosphorus left on the surface can move with runoff to water bodies.

In no-till systems, subsurface banded phosphorus is more popular because phosphorus is placed below the soil surface, thus less vulnerable to runoff losses. In general, banded phosphorus is more efficient than broadcast phosphorus. In the concentrated fertilizer band, less soil reacts with the fertilizer granules, thus reducing phosphorus fixation, allowing improved plant phosphorus uptake. Some planting equipment configurations have the ability to place fertilizer near or with seed, which further optimizes fertilizer placement and timing for young plants.

For more information on 4R phosphorus management, please read this excellent open-access review article: Grant, C.A., and D.N. Flaten. 2019. J. Environ. Qual. 48(5):1356–1369.