

• Shopping Cart Shopping Cart
    0Shopping Cart
Agvise Laboratories
  • Services
    • For Agriculture
    • For Lawn & Garden
    • For GLP Clients
    • AGVISOR Login
    • Pay Invoice Online
  • Resources
    • Forms & Guides
    • Agronomy Blog
    • Newsletter
    • Soil Test Summary
    • Seminars & Events
    • Precision Ag Helpers
    • Sign Up for Updates
  • Store
    • Hand Equipment
      • Soil Probe Handle
      • Soil Probe Tube
      • Accessories
    • Hydraulic Equipment
      • Soil Sampling System Kit
      • Power Unit
      • Soil Probe – Quicktach
      • Accessories
      • Replacement Parts
      • Wintex 1000
      • Used Equipment
    • Soil Grinding Equipment
      • Soil Grinding System
      • Replacement Parts
    • Supplies
      • Submission Forms
      • Bags and Containers
      • Shipping
      • Research Project Media
  • About Us
    • People
    • History
    • Certifications
  • Contact Us
    • Email
    • Locations
    • Employment
    • Update Contact Information
  • AGVISOR Login
  • Pay Invoice
  • Menu Menu
Blog
John Lee

Starter Fertilizer Display: How low can YOU go?

March 5, 2021/in Canola, Corn, Phosphorus, Soybean, Starter Fertilizer, Sugar Beet, Wheat/by John Lee

When profits are squeezed, more farmers are asking about optimal starter fertilizer rates and how low starter fertilizer rates can be. These questions are the result of wanting to keep fertilizer costs down, to plant as many acres per day as possible, and to take advantage of more efficient, lower rates of banded phosphorus fertilizer compared to higher rates of broadcast phosphorus fertilizer.
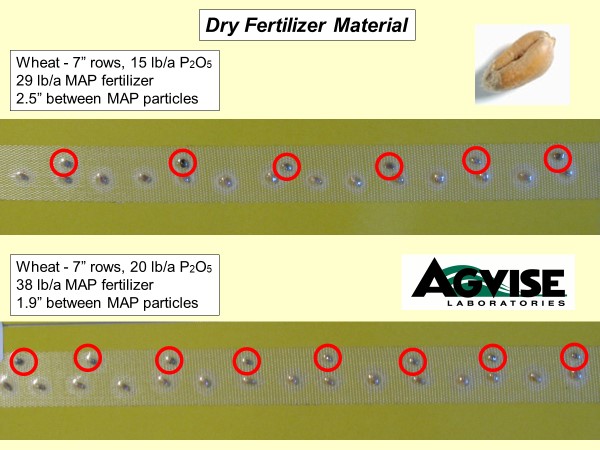
To illustrate the role of starter fertilizer rates and seed placement, we put together displays showing the distance between fertilizer granules or droplets at various rates and row spacings. You can see several pictures with canola, corn, soybean, sugar beet, and wheat. We greatly thank John Heard with Manitoba Agriculture for helping with the displays.

The displays show the normal seed spacing for several crops with different dry or liquid fertilizer rates alongside the seed. These displays help visualize the distance between the seed and fertilizer at several rates. University research shows that to achieve the full starter effect, a fertilizer granule or droplet must be within 1.5-2.0 inches of each seed. If the fertilizer granule or droplet is more than 1.5-2.0 inches away from the seed, the starter effect is lost. Some people wonder about these displays, but you can prove it to yourself pretty easily. Just run the planter partially down on a hard surface at normal planting speed. You will see what you imagine as a constant stream of liquid fertilizer, ends up being individual droplets at normal speed, especially with narrow row spacings and lower fertilizer rates.

These displays help illustrate the minimum starter fertilizer rate to maintain fertilizer placement within 1.5-2.0 inches of each seed for the full starter effect. In addition to an adequate starter fertilizer rate, additional phosphorus and potassium should be applied to prevent nutrient mining, causing soil test levels to decline in years when minimum fertilizer rates are applied.

Share:
  • Share on Facebook
  • Share on X
  • Share on WhatsApp
  • Share on LinkedIn
  • Share by Mail
https://www.agvise.com/wp-content/uploads/2020/05/agvise_page_logo_png.png 0 0 John Lee https://www.agvise.com/wp-content/uploads/2020/05/agvise_page_logo_png.png John Lee2021-03-05 14:21:052021-03-05 14:21:05Starter Fertilizer Display: How low can YOU go?

Article Categories

  • AGVISE Laboratories
    • Quality Control
    • Regional Data
    • Research
  • Crop Management
    • Canola
    • Corn
    • Cover Crop
    • Lawn and Garden
    • Potato
    • Prevented Planting
    • Soybean
    • Sugar Beet
    • Sunflower
    • Wheat
  • Environment
    • Drought
    • Water Quality
  • Fertilizer
    • Crop Removal
    • Fertilizer Placement
    • In-Season Fertilizer
    • Starter Fertilizer
  • Integrated Pest Management
    • Disease
    • Weed
  • Manure
  • Plant Analysis
    • Troubleshooting
  • Soil Analysis
    • Soil Biological Analysis
    • Soil Chemical Analysis
    • Soil Physical Analysis
  • Soil Fertility and Plant Nutrition
    • Base Cation Saturation Ratio
    • Calcium
    • Micronutrients
      • Copper
      • Iron
      • Molybdenum
      • Zinc
    • Nitrogen
    • Phosphorus
    • Potassium
    • Soil pH
    • Sulfur
  • Soil Health
  • Soil Management
    • Saline and Sodic Soil
    • Soil Amendment
    • Soil Erosion
    • Tillage
  • Soil Sampling
    • Equipment
    • Precision Ag

Northwood Laboratory

804 Hwy 15 West
P.O. Box 510
Northwood, ND 58267
Phone: 701-587-6010
Fax: 701-587-6013

Benson Laboratory

902 13th Street North
P.O. Box 187
Benson, MN 56215
Phone: 320-843-4109
Fax: 320-843-2074

Canada Shipping Address

380 Kimberly Road
Winkler, MB R6W 0H7
Phone: 701-587-6010


© Copyright - Agvise Laboratories Privacy Policy   Cookie Policy
  • Link to X
  • Link to LinkedIn
  • Link to Facebook
  • Link to Youtube
  • Home
  • Services
  • Resources
  • Store
  • About Us
  • Contact Us
Link to: Adjusting low soil pH with sugar beet-processing spent lime Link to: Adjusting low soil pH with sugar beet-processing spent lime Adjusting low soil pH with sugar beet-processing spent lime Link to: Soil aggregate stability: What does it measure? Link to: Soil aggregate stability: What does it measure? Soil aggregate stability: What does it measure?
Scroll to top