Adjusting high soil pH with elemental sulfur
Soil pH is a soil chemical property that measures soil acidity or alkalinity, and it affects many soil chemical and biological activities. Soils with high pH can reduce the availability of certain nutrients, such as phosphorus and zinc. Soils of the northern Great Plains and Canadian Prairies often have high soil pH (>7.3) and contain calcium carbonate (free lime) at or near the soil surface. It is the calcium carbonate in soil that maintains high soil pH and keeps it buffered around pH 8.0. The calcium carbonate originates from soil formation processes since the latest glacial period.
An unfounded soil management suggestion is that soil pH can be successfully reduced by applying moderate rates of elemental sulfur (about 100 to 200 lb/acre elemental S). Elemental sulfur must go through a transformation process called oxidation, converting elemental sulfur (S0) to sulfuric acid (H2SO4), a strong acid. Sulfuric acid does lower soil pH, but the problem is the amount of carbonate in the northern region, which commonly ranges from 1 to 5% CCE and sometimes over 10% CCE. Soils containing carbonate (pH >7.3) will require A LOT of elemental sulfur to neutralize carbonate before it can reduce soil pH.
To lower pH in soils containing carbonate, the naturally-occurring carbonate must first be neutralized by sulfuric acid generated from elemental sulfur. You can visualize the fizz that takes place when you pour acid on a soil with carbonate. That fizz is the acid reacting with calcium carbonate to produce carbon dioxide (CO2) gas. Once all calcium carbonate in soil has been neutralized by sulfuric acid, only then can the soil pH be lowered permanently. It is important to note that sulfate-sulfur sources, such as gypsum (calcium sulfate, CaSO4), do not create sulfuric acid when they react with soil, so they cannot neutralize calcium carbonate or change soil pH (Figure 1).
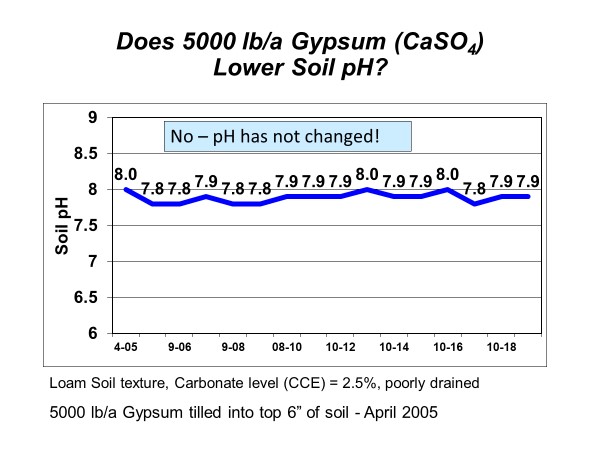
Figure 1. Soil pH following gypsum application on soil with high pH and calcium carbonate.
In 2005, AGVISE Laboratories installed a long-term demonstration project evaluating elemental sulfur and gypsum on a soil with pH 8.0 and 2.5% calcium carbonate equivalent (CCE). The highest elemental sulfur rate was 10,000 lb/acre (yes, 5 ton/acre)! We chose such a high rate because the soil would require a lot of elemental sulfur to neutralize all calcium carbonate. Good science tells us that 10,000 lb/acre elemental sulfur should decrease soil pH temporarily, but it is still not enough to lower soil pH permanently. In fact, this is exactly what we saw (Figure 2). Soil pH declined in the first year, but it returned to the initial pH over subsequent years because the amount of elemental sulfur was not enough to neutralize all calcium carbonate.
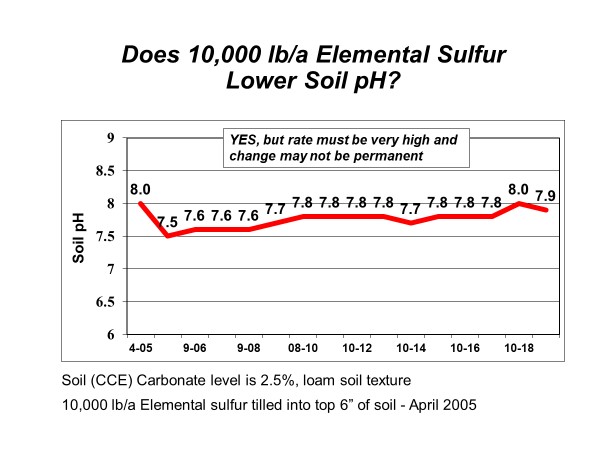
Figure 2. Soil pH following elemental sulfur application on soil with high pH and calcium carbonate.
A quick calculation showed that the soil with 2.5% CCE would require about 16,000 lb/acre elemental sulfur to neutralize all calcium carbonate in the topsoil. Such high rates of elemental sulfur are both impractical and expensive on soils in the northern Great Plains. The only thing to gained is a large bill for elemental sulfur. While high soil pH does lower availability of phosphorus and zinc, you can overcome these limitations with banded phosphorus fertilizer and chelated zinc on sensitive crops. All in all, high soil pH is manageable with the appropriate strategy. That strategy does not involve elemental sulfur.