Soil Nitrogen Trends – Fall 2021; High Variability Following Drought
This article was originally published following the 2021 drought.
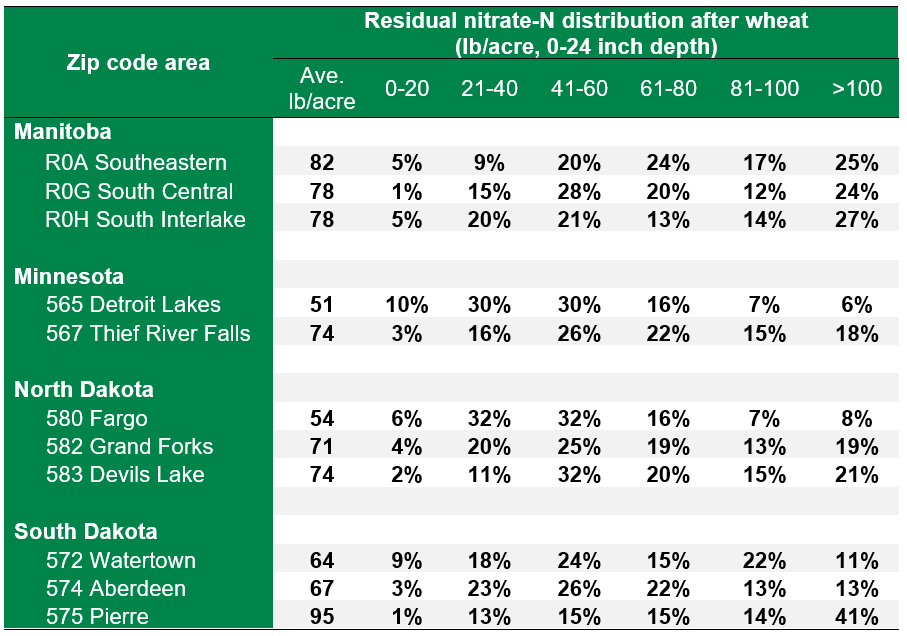
The 2022 growing season may seem like a long way off, but spring will be here before we know it. In fact, many growers are already making (or have made) crop choices and seed variety decisions for 2022. One factor that must be considered when making crop and variety selections for 2022 is residual soil nitrate-nitrogen following the 2021 growing season. For many in the northern Great Plains and Canadian Prairies, the 2021 growing season was hot and dry, which resulted in high residual soil nitrate levels following many crops. An update on average residual nitrate levels after wheat, broken down by geography, is below (Table 1). Residual soil nitrate-nitrogen following other crops, including soybean, are also higher than average (Table 2). This highlights the importance of soil sampling, even after crops we do not typically think of leaving high residual soil nitrate behind.
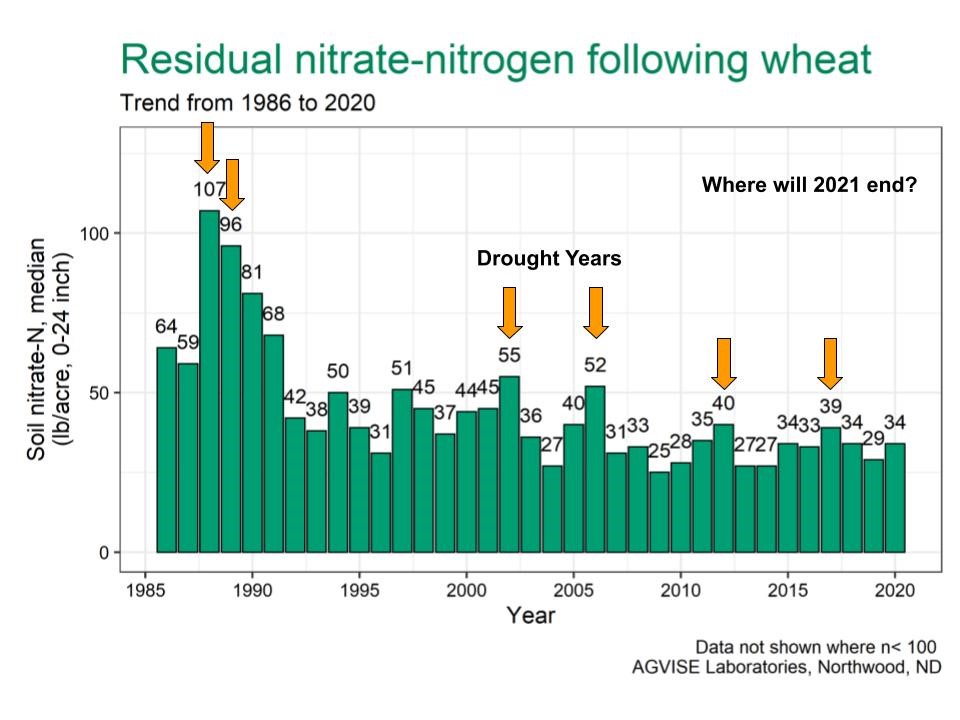
The data in the tables represents a snapshot of the samples we have tested so far this fall. While the average residual soil nitrate-nitrogen for an area may be interesting to talk about, it is not a replacement for actual soil test results from you or your growers’ fields. The data shows that over 30% of the wheat fields in many areas (see the right-hand column of the table) test over 100 lb/acre soil nitrate (0-24 inch depth). Droughts like 1988 and 2021 are very uncommon and leave us in situations that we are not used to dealing with. Using an average soil nitrate level from a region to decide an N rate on an individual field would be like deciding to apply an insecticide on every acre of the farm without even looking at each field to see if the insect is present. You need actual soil test data on each field to make informed decisions.
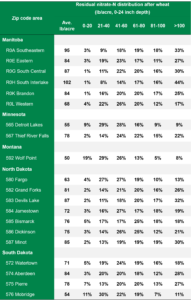
Table 1. Residual nitrate trends as of Sept. 17, 2021 from more than 20,000 soil samples taken after wheat. Regions with less than 100 soil samples are not included in the table.
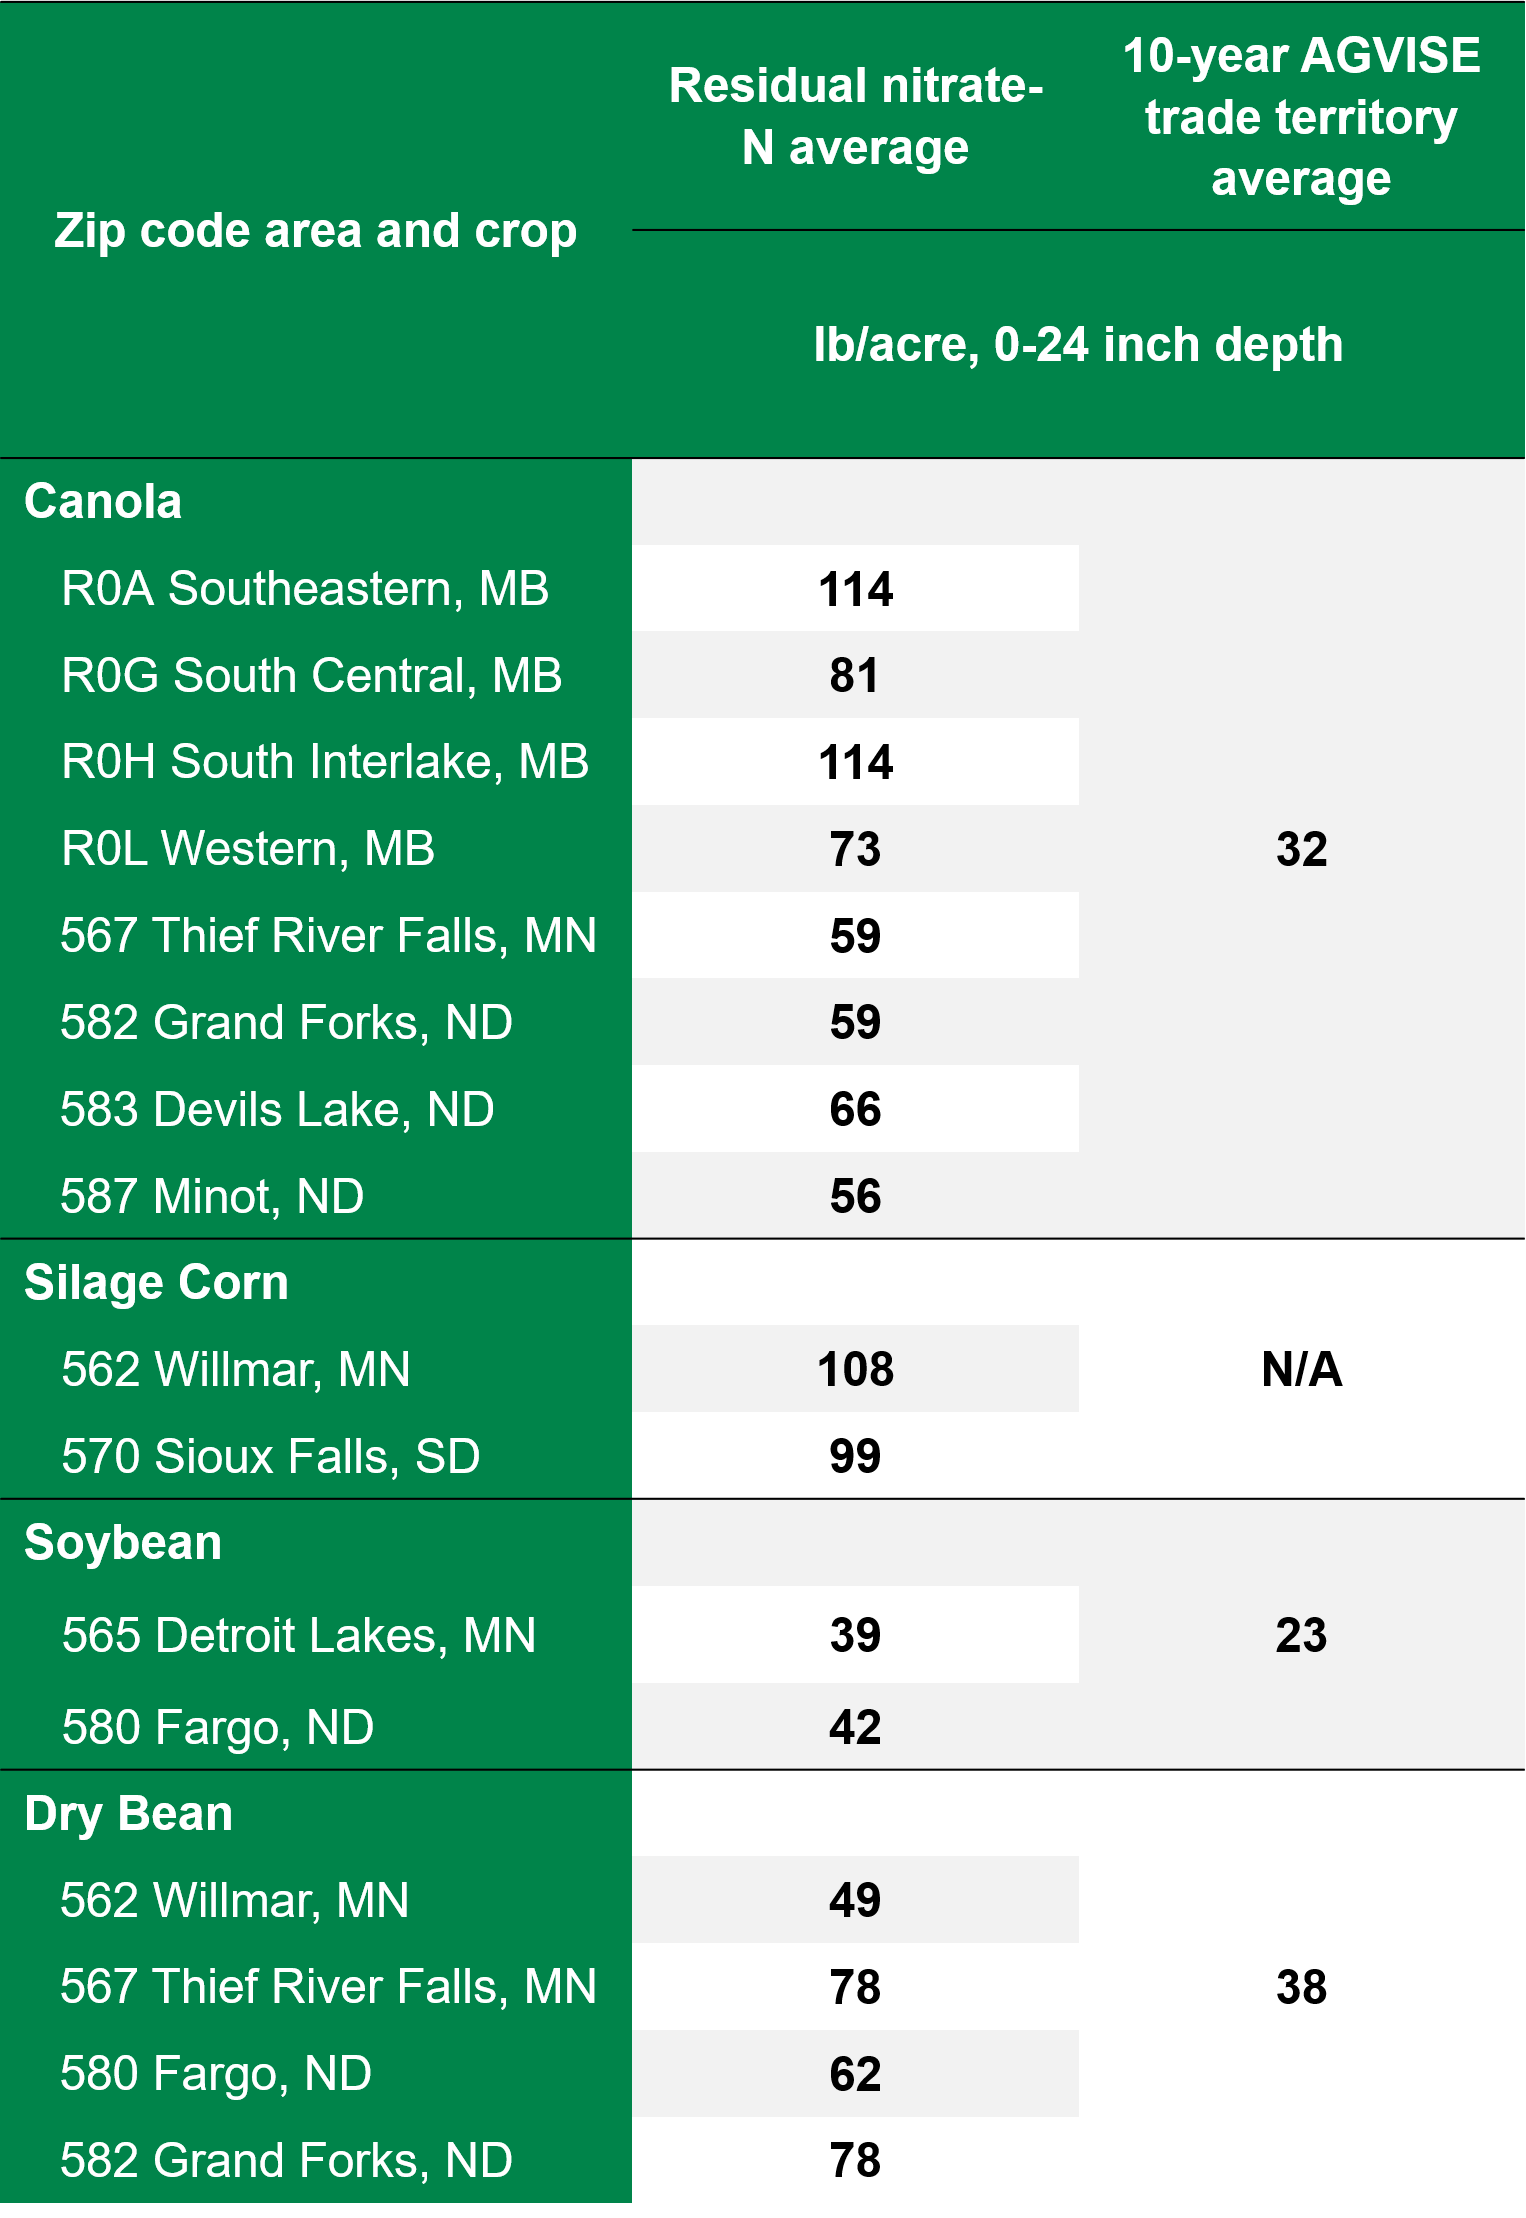
Table 2. Residual nitrate trends as of Sept. 17, 2021 for crops other than wheat. Regions with less than 100 soil samples for each respective crop are not included in the table.
High Fertilizer Prices
According to the September 15, 2021 DTN fertilizer price survey, retail fertilizer prices continue to rise. The average price per pound of nitrogen by fertilizer product is $0.61/lb N for urea, $0.46 lb/N for anhydrous ammonia, and $0.66/lb N for UAN-28. This represents a 55%, 73%, and 71% increase in price compared to prices for the same fertilizers this time last year. Long story short, fertilizer is expensive. High residual soil nitrate following wheat may help reduce input costs in 2022, as long as you know what the residual soil nitrate in your fields is and take advantage of it by growing a crop that requires nitrogen fertilizer. If you have a soil nitrate test of 80 lb/acre (0-24 inch) after wheat, that is about 50 lb more than normal carry over. The extra 50 lb/acre soil nitrate is worth $30.00/acre (based on the current urea price).