Potassium is back on the radar for many farmers and agronomists across the upper Midwest and northern Great Plains. In the past two weeks, corn growth and development have reached the stage where potassium deficiencies are becoming quite apparent, and widespread dry soil conditions during the 2021 drought have worsened the problem. In some instances, corn is displaying potassium deficiency symptoms on soils with medium to high soil test K (120 to 180 ppm) in spite of potassium fertilizer application.
Potassium is required in large quantities for plant growth and development. The plant tissue K range in normal corn plants is 3-5% K, which is similar to nitrogen. A 200-bushel/acre corn crop will typically uptake 200 lb N, 108 lb P2O5, and 280 lb K2O per acre through the growing season (IPNI, 2014). In other words, an actively growing corn crop takes a lot of potassium! Luckily, you do not have to apply all that potassium as fertilizer, and much will come from the plant-available K pool in the soil.
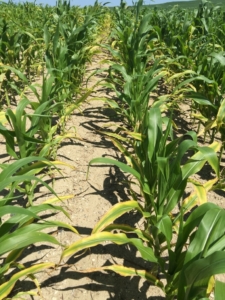
Potassium deficiency in corn. Symptoms are leaf chlorosis (yellowing) and necrosis (death) beginning at the leaf tip and outer leaf margin and progressing toward the midrib, often with wavy leaf edges. Potassium is mobile in the plant, so symptoms appear on the lower leaves first as the plant remobilizes potassium from lower leaves to support new plant growth.
Drought reduces potassium availability
The plant-available K pool becomes less available when soil water is limited. This has become the top story as the 2021 drought has continued. Plant roots acquire potassium mostly through a process called diffusion. Diffusion is the slow movement of ions through water around soil particles to the plant root for uptake. As soil becomes drier, the thickness of the water film around soil particles becomes thinner and thinner, thus the diffusion path for potassium ions becomes longer and longer. The soil pore space becomes mostly air with little water remaining. This ultimately slows the rate at which potassium from soil or fertilizer can reach the plant root, and potassium deficiency may occur.
The consequence of the drought-induced potassium deficiency is two-fold because potassium also plays an essential role in plant water regulation. Potassium-stressed plants experience reduced photosynthesis and transpiration rates, resulting in poor water use efficiency of the already limited soil water that is available. In a nutshell, low soil water content reduces potassium availability from soil and fertilizer, and then the soil water that is there is poorly utilized because of the lack of potassium. In addition to limited soil water, other factors compound to reduce potassium uptake: soil test K, soil texture, clay mineralogy, soil compaction, and even fluffy soil syndrome.
Believe it or not, fluffy soil syndrome has been a component of more than one phone call concerning potassium deficiency. Do you see greener plants near the planter wheel tracks or sprayer tracks? Fluffy soil syndrome occurs when soil has not completely settled since spring tillage, which results in poor soil particle-to-particle contact and slow soil-water-root diffusion routes for potassium ions. The wheel tracks adequately firmed the soil to provide good soil particle-to-particle contact, maintaining better potassium diffusion.
Potassium deficiency in corn: A case study
In June 2021, AGVISE started to receive plant and soil samples to diagnose suspected potassium deficiencies in various crops. This corn example from west central Minnesota included plant and soil samples collected in the good and poor areas of the field. The leaf K concentration was 0.59% in the good and 0.52% in the poor area. For comparison, the corn leaf K sufficiency range at this growth sage should be 2-3% K. The corresponding soil samples had soil test K at 148 ppm in the good and 140 ppm in the poor area. The soil test K critical level for corn is 150-200 ppm, and the farmer had applied 50 lb/acre K2O broadcast + incorporation, which is very close to the university sufficiency guideline for corn. Although the farmer more or less did everything right for a normal rainfall year, drought conditions have reduced potassium availability to the point where potassium deficiency symptoms were apparent and visible.
One week after the plant and soil samples were collected, the field received an inch of rain, and the potassium deficiency symptoms disappeared! The entire corn field is green now. It is amazing what a little water will fix.
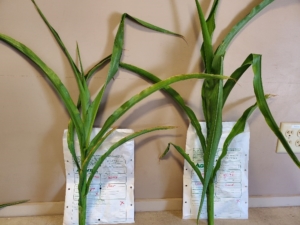
Potassium deficiency in corn confirmed with plant and soil analysis. Potassium-deficient corn plant (left) displays chlorosis and necrosis of the outer leaf margin and wavy leaf edge. Plant and soil samples were collected June 2021 in west central Minnesota.
Correcting the problem
So, what do you do next? Do you try to apply an in-season rescue potassium fertilizer application? You still need rain to water in any fertilizer applied to the soil surface. If you had applied an adequate amount of potassium fertilizer before planting, then the appropriate decision is to wait for rain to improve soil and fertilizer potassium availability. However, some people may not have applied enough potassium initially. In these cases, a rescue application of 60 lb/acre K2O broadcast (100 lb/acre potash, 0-0-60) followed by some rain should correct the symptoms. Do not skimp with anything less because you are already behind the eight-ball and you will need that much material to cover the soil surface adequately and affect enough individual corn plants. In NDSU research (2014-2016), an uncorrected potassium deficiency in corn could cost 20-30 bushel/acre compared to corn receiving adequate potassium fertilizer.
For liquid materials, potassium acetate and potassium thiosulfate could be dribbled between the rows, but the potassium rate will need to be similar to the dry potassium fertilizer rate and cost will likely be greater. Remember, potassium is something required in large quantities, not something corrected with a small application of 5-10 lb/acre K2O.
There is no way we could have planned for the very dry conditions that are exacerbating potassium deficiency symptoms across the region. For the future, the best preventative strategy is precision soil sampling (grid or zone) and fertilizing accordingly. It is important to identify and address those parts of fields where potassium may be limiting crop yield potential and spend fertilizer dollars where needed.
Sampling Fields for Soybean Cyst Nematode (SCN)
in Disease, Soybean/by Richard JennySoybean cyst nematode (SCN) is a microscopic parasitic worm that attacks the roots of susceptible soybean and dry edible bean, causing unseen or unexplained yield losses. Soybean and dry edible bean are naturally susceptible to SCN, but through plant breeding, most soybeans have some level of resistance, varying in level from good to poor. The most common source of resistance to SCN in soybean is PI88788, which is about 30 years old, and many soybean growing areas have SCN populations that are becoming resistant to this source. The Peking source is a very effective SCN resistance source but is only available in less than 5% of all soybean varieties.
Soybean cyst nematode cysts each harbor hundreds of eggs. Cysts and eggs of SCN can survive in the soil and remain viable for many years even without a soybean or dry bean host. Any activity that moves soil around will move SCN, meaning that areas with a history of soybean production likely have or will have this pest. Soybean cyst nematodes were first reported in Minnesota in 1978, South Dakota in 1995, North Dakota in 2003, and Manitoba in 2019.
During the growing season, the developing SCN cysts containing the eggs can be seen on susceptible plant roots, as seen in the picture below. To get an accurate assessment of the infestation level of the field, you need to collect soil samples and submit them to a laboratory to get a measure of the SCN egg count.
SCN sampling strategies
The best time to collect SCN soil samples is at the end of the soybean growing season, right before harvest or just after harvest (before fall tillage starts). Fall soil sampling for SCN coincides with the highest egg counts in soil and typically falls in the months of September and October.
Collect 10-20 soil cores (6 to 8 inches deep) in the soybean row where SCN is likely present. Your goal is to collect infected soybean root tissue and capture the SCN cysts and eggs in the soil sample. Since SCN is a soil-borne pest, it moves wherever SCN-infested soil can enter the field. This includes field entry points where infested soil can be transferred on equipment and tires, places where wind-blown soil accumulates (e.g., fence lines), drainage ditches and flooded areas, and locations with consistently low soybean yield. Mix the soil cores together and take a subsample to fill the soil sample bag.
If you have never tested for SCN before, you will want to sample fields intended for soybean or dry bean for the presence of SCN and gather a baseline SCN egg count. If you know you have SCN, you will want to sample soybean fields twice during the year: once in June to get an initial SCN egg count and then again in the fall to get a final SCN egg count. The early and late SCN samples allow you to measure if SCN populations are being effectively controlled (i.e., no increase in SCN egg count) or if the soybean variety SCN resistance source is failing (i.e., SCN egg count increases). Choose a single point in the soybean field and collect 8-10 soil cores (6 to 8 inch soil depth) taken within the soybean row at that spot. Mix the cores together and fill a regular paper soil sample bag. Mark that point with a flag and collect its GPS coordinates. Come back to that exact spot in the fall and collect a second sample. This will help you assess how your SCN management strategies, including the soybean variety SCN resistance source and soybean seed treatment, are working in the field.
Preparing and sending SCN samples to AGVISE Laboratories
Please submit SCN soil samples on the bright-yellow SCN submission forms or use the online SCN submission option in AGVISOR. AGVISE provides special SCN submission forms and online label sheets at no charge. The bright-yellow forms and stickers helps us identify these special SCN samples and ensure that the SCN samples are not accidentally dried and ground like regular soil fertility samples.
All SCN samples are analyzed at the Benson, MN laboratory. You can send the SCN samples directly to the Benson laboratory (see address below) or to the Northwood laboratory, where we will forward them to Benson for analysis. AGVISE Laboratories reports SCN results in “eggs/100 cc” of soil and provides interpretation on the SCN report informed by university research.
Helpful resources
Soybean Cyst Nematode Resource Compendium, Iowa State University
Soybean Cyst Nematode (SCN) Management, Univ. Minnesota
Soybean Cyst Nematode, NDSU
Soybean Cyst Nematode in South Dakota: History, Biology, and Management, SDSU
The SCN Coalition Website
Tips for Soil Sampling in Dry Conditions
in Drought, Equipment, Soil Sampling/by John LeeSoil sampling in dry conditions can be difficult. The ground is hard, fields are dry, and getting a consistent soil core depth can take more time than usual. To help you take the best soil samples this fall, we’ve put together some tips and tricks for sampling in dry soil conditions that, when implemented, will help you save time and frustration in the field.
Soil sampling equipment
AGVISE Laboratories has provided soil sampling equipment for over 40 years. Our hydraulic soil sampling system will enable you to get high-quality soil cores, even in hard, dry soils. The electric-hydraulic power unit paired with easy-to-change Quicktach probes will make adapting to challenging soil sampling conditions simple and easy. You can find more about our equipment on our online store.
Best soil probe body
The heavy-duty (HD) probe body is made from chromoly steel. This thick-walled, hard steel probe body will resist bending under hard, dry, or frozen soil conditions (compared to softer stainless steel). The HD probe body comes in two options: solid and slotted. If the topsoil is powder dry, it is best to use the HD solid probe body, as powder-dry soil may fall out of the slot. Stainless steel probe bodies work great in most situations but in hard, dry soils the stainless-steel probe body may bend more easily than the HD probe body.
Best soil probe tip
AGVISE Laboratories carries two tips for the HD probe body. The HD “dry tip” has a sharp cutting edge and large opening (3/4-inch) that works great in hard, dry soils. It is our leading recommendation for such conditions. If you are soil sampling fine-textured clay soils, even under dry conditions, the HD “wet tip” may also work well for you because there is usually a little moisture remaining at the lower end of the 24” soil profile. It is a good idea to have both the HD dry and HD wet tips with you in the sampling rig. As soil conditions change, you can use the soil probe tip that gives you the best quality soil cores.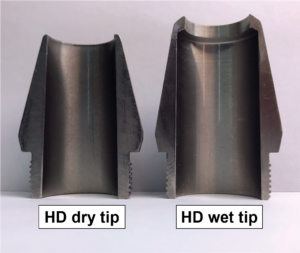
Solving common very dry soil sampling problems
What do I do if the soil probe comes up empty?
Under very dry soil conditions, sometimes the soil probe comes up empty because soil falls out the bottom of the probe. One trick to overcome this is to push the probe all the way to 24-inch (or to the end of its cycle), then lift the probe up a few inches and push it back down to 24-inch. This creates a slight plug at the bottom of the soil core that prevents soil from falling out the bottom. It seems like such a simple solution, but it works!
What if I can’t get full 24-inch soil cores and the soil probe tip has a hard plug in it, which is preventing soil from flowing into the probe body?
You are probably using a tip with an opening diameter that is too small. Dry soil does not compress well and sometimes it will not flow through a smaller tip opening. The HD dry tip has a 3/4-inch that is large enough to allow dry soil to flow into the soil probe.
Will WD-40 help me get better quality soil cores if the soil is dry and hard?
There is no benefit to using a lubricant such as WD-40 under very dry soil conditions. Dry soil is much less likely to plug the soil probe than wet soil. If you are running into a few plugged tips with the HD dry tip, try the HD wet tip. You are probably finding a layer of wet soil deeper in the soil profile. The HD wet tip has a recessed lip that will prevent plugging and will handle this layer better than the HD dry tip.
What if I can’t get a full 6-24-inch soil core? Should I change anything in the information I submit to the laboratory?
If you are unable to get a full second soil depth (6-24-inch soil core), it is important that the information you submit to the laboratory matches the soil depth you actually collected. Mobile soil nutrients like nitrate-nitrogen are tested on the second soil depth and results are calculated based on soil core length. If the soil core is shorter than what was written on the submission form or submitted in AGVISOR, the soil test nitrate-nitrogen result will be overestimated.
Preventing fires when soil sampling
No one wants to start a fire while in the field. Unfortunately, driving anything with an engine over dry crop residue creates a fire risk. John Lee, soil sampling and testing veteran, has seen this happen firsthand. “I started a corn stalk field on fire when I was soil sampling one of my dad’s fields in college,” said Lee. “The fire was put out quickly, but I was embarrassed that I did not have anything in the truck with me to put the fire out.”
After visiting with several customers with many years’ experience soil sampling in dry conditions, we compiled a list of practices that can reduce the chance of fire while soil sampling.
Fire suppressing items to keep in your soil sampling rig
Remember that most fires start under the truck where straw or chaff accumulates on exhaust pipes, mufflers, etc. Your firefighting equipment needs to be long enough to reach these areas if a fire does start.
Practices to reduce fire risk before one starts
Lessons (Ghosts) of Droughts Past
in Drought, Nitrogen, Regional Data/by John LeeFrom Alberta to Iowa, the region has experienced everything from abnormally dry soil conditions to exceptional drought. In some places, the drought started in 2020 and has continued through 2021. Considering lower than expected crop yields, we expect that residual soil nitrate-nitrogen levels will be much higher than normal in many wheat, canola, and corn fields this fall. There was reduced crop nitrogen uptake and little to no soil nitrogen losses to leaching or denitrification through the growing season, which should result in higher soil test nitrate-N remaining in the soil profile.
In major drought years, high residual nitrate levels are a normal phenomenon. In 1988, the average soil nitrate test following wheat across the region was a staggering 107 lb/acre nitrate-N (0-24 inch soil profile). This is considerably higher than the long-term average around 30-45 lb/acre nitrate-N (0-24 inch soil profile). The 1988 drought was extreme, and 2021 has rivaled that in some locations. Based on previous drought years, it will be no surprise to find wheat fields with 80-100 lb/acre nitrate-N (0-24 inch soil profile) or even higher.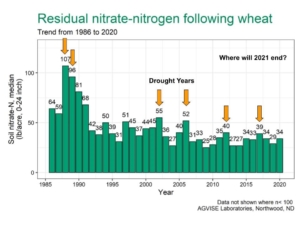
Past experience also shows us that drought can create greater crop yield variability across fields. Some zones in the field with better water holding capacity and soil organic matter may have produced a decent crop yield, and these will have lower residual soil nitrate-N. Yet, other zones may have had very poor crop growth and yield, leaving very high amounts of soil nitrate-N remaining.
Zone soil sampling is always a good idea, but it is especially important in drought years. Soil sampling based on productivity zones is the only way to determine the correct amount of nitrogen fertilizer in each zone across the field. To create good productivity zones for soil sampling, it is best to use multiple data layers such as satellite imagery, crop yield maps, topography, or electrical conductivity (Veris or EM38).
This fall, we expect residual soil nitrate-N to be higher than normal, but there will be exceptions to the rule. Last spring, there was a lot of broadcast urea fertilizer applied without incorporation. If no rain was received for several weeks after application, much of the nitrogen could have been lost to ammonia volatilization. This means some fields will seem out of place with lower residual soil nitrate-nitrogen because fertilizer nitrogen was lost last spring.
For fields with more than 150 lb/acre nitrate-N (0-24 inch soil profile), the crop nitrogen requirement for next year may not call for much, if any, nitrogen fertilizer. We must remember that drought creates variability within a field and even within large productivity zones. This is why we always suggest applying a base amount of nitrogen fertilizer to address the variability, even if the soil nitrate test is more than 150 lb/acre nitrate-N. A base nitrogen fertilizer rate (maybe 20 to 40 lb/acre N) should address most of the field variability and provide a fast start to the next year’s crop. In 1988, we learned the tough lesson that applying no nitrogen fertilizer on fields testing very high for nitrate-N was a mistake, and the best producing parts of fields had early-season nitrogen deficiencies. A modest base nitrogen fertilizer rate was the right decision to cover field variability.
Three Simple Lessons from Droughts Past
Save Time and Avoid Mistakes by Using AGVISOR to Submit Soil Samples Online
in AGVISE Laboratories/by Jodi BoeAGVISE Laboratories is always trying to make soil sampling easier. Since 2011, AGVISE customers have enjoyed submitting soil samples online through our AGVISOR platform. AGVISOR is the online platform that allows you to submit soil samples (conventional, grid/zone, and soybean cyst nematode samples); save grower and field information (so you don’t have to fill it in by hand on paper forms); and set default crop fertilizer guidelines. With online submission, you simply submit the sample information online and print barcode reference number stickers to place on each soil sample bag (like below). There is no more handwriting on soil sample bags or forms anymore!
With the online AGVISOR platform, organizing your sampling operation is easy. You can save time by submitting soil samples ahead of time and printing reference number stickers before the fall soil sampling rush begins. If you are working with a third-party sampler, you can submit samples online and then email a PDF of the barcode reference stickers to the sampler, allowing them to print the stickers at their location.
In addition to submitting samples online, the AGVISOR platform allows you to view, print, and save soil test reports. This means you can save soil test reports and send them as PDFs to growers. AGVISOR also allows you to change crop choice, yield goal, and fertilizer guideline type (broadcast vs. band). The flexibility of the platform makes it easy to keep up with changes that inevitably happen in farming.
If you have any questions on how to access AGVISOR or need help navigating the online submission and results platform, please give one of our Laboratories (Northwood 701-587-6010; Benson 320-843-4109) a call and our technical staff will be happy to help you.
Potassium and Drought: A Two-fold Water Uptake Problem
in Corn, Drought, Potassium, Troubleshooting/by John BrekerPotassium is back on the radar for many farmers and agronomists across the upper Midwest and northern Great Plains. In the past two weeks, corn growth and development have reached the stage where potassium deficiencies are becoming quite apparent, and widespread dry soil conditions during the 2021 drought have worsened the problem. In some instances, corn is displaying potassium deficiency symptoms on soils with medium to high soil test K (120 to 180 ppm) in spite of potassium fertilizer application.
Potassium is required in large quantities for plant growth and development. The plant tissue K range in normal corn plants is 3-5% K, which is similar to nitrogen. A 200-bushel/acre corn crop will typically uptake 200 lb N, 108 lb P2O5, and 280 lb K2O per acre through the growing season (IPNI, 2014). In other words, an actively growing corn crop takes a lot of potassium! Luckily, you do not have to apply all that potassium as fertilizer, and much will come from the plant-available K pool in the soil.
Potassium deficiency in corn. Symptoms are leaf chlorosis (yellowing) and necrosis (death) beginning at the leaf tip and outer leaf margin and progressing toward the midrib, often with wavy leaf edges. Potassium is mobile in the plant, so symptoms appear on the lower leaves first as the plant remobilizes potassium from lower leaves to support new plant growth.
Drought reduces potassium availability
The plant-available K pool becomes less available when soil water is limited. This has become the top story as the 2021 drought has continued. Plant roots acquire potassium mostly through a process called diffusion. Diffusion is the slow movement of ions through water around soil particles to the plant root for uptake. As soil becomes drier, the thickness of the water film around soil particles becomes thinner and thinner, thus the diffusion path for potassium ions becomes longer and longer. The soil pore space becomes mostly air with little water remaining. This ultimately slows the rate at which potassium from soil or fertilizer can reach the plant root, and potassium deficiency may occur.
The consequence of the drought-induced potassium deficiency is two-fold because potassium also plays an essential role in plant water regulation. Potassium-stressed plants experience reduced photosynthesis and transpiration rates, resulting in poor water use efficiency of the already limited soil water that is available. In a nutshell, low soil water content reduces potassium availability from soil and fertilizer, and then the soil water that is there is poorly utilized because of the lack of potassium. In addition to limited soil water, other factors compound to reduce potassium uptake: soil test K, soil texture, clay mineralogy, soil compaction, and even fluffy soil syndrome.
Believe it or not, fluffy soil syndrome has been a component of more than one phone call concerning potassium deficiency. Do you see greener plants near the planter wheel tracks or sprayer tracks? Fluffy soil syndrome occurs when soil has not completely settled since spring tillage, which results in poor soil particle-to-particle contact and slow soil-water-root diffusion routes for potassium ions. The wheel tracks adequately firmed the soil to provide good soil particle-to-particle contact, maintaining better potassium diffusion.
Potassium deficiency in corn: A case study
In June 2021, AGVISE started to receive plant and soil samples to diagnose suspected potassium deficiencies in various crops. This corn example from west central Minnesota included plant and soil samples collected in the good and poor areas of the field. The leaf K concentration was 0.59% in the good and 0.52% in the poor area. For comparison, the corn leaf K sufficiency range at this growth sage should be 2-3% K. The corresponding soil samples had soil test K at 148 ppm in the good and 140 ppm in the poor area. The soil test K critical level for corn is 150-200 ppm, and the farmer had applied 50 lb/acre K2O broadcast + incorporation, which is very close to the university sufficiency guideline for corn. Although the farmer more or less did everything right for a normal rainfall year, drought conditions have reduced potassium availability to the point where potassium deficiency symptoms were apparent and visible.
One week after the plant and soil samples were collected, the field received an inch of rain, and the potassium deficiency symptoms disappeared! The entire corn field is green now. It is amazing what a little water will fix.
Potassium deficiency in corn confirmed with plant and soil analysis. Potassium-deficient corn plant (left) displays chlorosis and necrosis of the outer leaf margin and wavy leaf edge. Plant and soil samples were collected June 2021 in west central Minnesota.
Correcting the problem
So, what do you do next? Do you try to apply an in-season rescue potassium fertilizer application? You still need rain to water in any fertilizer applied to the soil surface. If you had applied an adequate amount of potassium fertilizer before planting, then the appropriate decision is to wait for rain to improve soil and fertilizer potassium availability. However, some people may not have applied enough potassium initially. In these cases, a rescue application of 60 lb/acre K2O broadcast (100 lb/acre potash, 0-0-60) followed by some rain should correct the symptoms. Do not skimp with anything less because you are already behind the eight-ball and you will need that much material to cover the soil surface adequately and affect enough individual corn plants. In NDSU research (2014-2016), an uncorrected potassium deficiency in corn could cost 20-30 bushel/acre compared to corn receiving adequate potassium fertilizer.
For liquid materials, potassium acetate and potassium thiosulfate could be dribbled between the rows, but the potassium rate will need to be similar to the dry potassium fertilizer rate and cost will likely be greater. Remember, potassium is something required in large quantities, not something corrected with a small application of 5-10 lb/acre K2O.
There is no way we could have planned for the very dry conditions that are exacerbating potassium deficiency symptoms across the region. For the future, the best preventative strategy is precision soil sampling (grid or zone) and fertilizing accordingly. It is important to identify and address those parts of fields where potassium may be limiting crop yield potential and spend fertilizer dollars where needed.
Plant Sampling Basics – Sampling, storing, and shipping plant samples
in Plant Analysis/by Jodi BoePlant sampling season is in full swing. Agronomists submit plant samples for analysis for a number of reasons: to confirm visible nutrient deficiency symptoms, to detect “hidden hungers”, and to monitor or fine-tune fertilizer plans. For whatever reason you plan to take plant samples, here is a quick refresher on sampling, storing, and shipping plant samples to AGVISE Laboratories.
Sampling
Collecting the correct plant part is critical for interpreting plant analysis results. Make sure to identify the current plant growth stage and follow the directions for that specific crop and growth stage, displayed on the back of the AGVISE plant sample bag. Do you need AGVISE plant sample bags? You can request them here. If you are sampling a crop not listed on the plant sample bag, please call one of our laboratories for instructions.
Plant sampling instructions on the back of AGVISE Laboratories plant sample bag. Please use an AGVISE Laboratories bag to submit plant samples for analysis. We send them to AGVISE customers at no charge. Request them here.
Collect the number of plants or leaves indicated in the instructions. This ensures you have a good sample and that we have enough plant material at the laboratory to analyze. About 2 cups of plant material are typically enough.
Roughly 2 cups of plant material (above) are what we require to complete the laboratory analysis.
Storing – Plant Sample Care
Shipping – United States Customers
United States customers can send their plant samples to either AGVISE laboratory. Shipping addresses for both are listed at the end of this webpage. You can ship samples to us via your preferred parcel carrier (e.g. USPS, UPS, FedEx, Spee-Dee, etc.). The sooner the sample arrives at the laboratory after being collected, the better. If you are sending multiple samples together in a box, do not pack samples too tightly in the box; leave room for some airflow.
Shipping – Canadian Customers
Canadian customers can drop off plant samples at any of the four Manitoba AGVISE dropbox locations: Portage la Prairie, Carman, Altona, or Winkler (see location info here). During the summer, the AGVISE route truck picks up samples from these locations on Tuesdays, Thursdays, and Saturdays. It is best to place your sample(s) in the dropbox the night before the route truck is scheduled. As long as the plant sample bag is ventilated, the sample will be okay sitting in the dropbox overnight. Samples dropped off in Winkler and Portage la Prairie can be placed inside refrigerators at the dropbox locations.
If you are located farther away from the Manitoba dropbox locations, please send your plant samples by Purolator ONLY to AGVISE Laboratories, 380 Kimberly Road, Winkler, MB R6W 0H7.
Additional information on sampling, storing, and shipping plant samples to AGVISE Laboratories can be found in the AGVISE Plant Sampling Guide.
Please contact us if you have any questions on plant sampling and analysis or need any supplies.
Is PI88788 Working in Your Soybean Fields?
in Disease, Soybean/by Brent JaenischSoybean Cyst Nematode (SCN) is the number one crop yield-reducing pest in soybean production. Potential crop yield loss to SCN is expected to rise as more and more populations of SCN overcome the PI88788 resistance source. The Peking resistance source is not as common as the PI88788, but it is becoming incorporated into more soybean varieties.
If you want to see how the SCN resistance source in your soybeans is holding up this growing season, you can do an early and late SCN soil test. If the egg count increases substantially between the early and late SCN sample, your SCN resistance source is likely failing.
Here are the 4 steps to this simple test.
Collect an early SCN sample (June)
Collect a late SCN sample (mid to late August)
4. Return to same location as the SCN sample from June. Repeat step #2.
Once you have conducted this simple test, you will get an idea of whether or not the SCN resistance source in your soybean varieties is controlling SCN populations, or if it is time to change resistance source in soybean varieties next year. If the SCN egg count increases during the year, that SCN resistance source is not adequately controlling SCN in your field.
AGVISE Laboratories has completed a number of SCN demonstration projects since 2019, using the early vs. late SCN sampling procedure. The projects have shown that the PI88788 resistance source is not adequately controlling SCN populations at some field sites in west-central Minnesota. More information can be found in our agronomy blog for the 2020 and 2021 projects.
Data from the AGVISE SCN field project, 2019-2020.
A silver bullet for managing SCN does not exist and will likely never exist. Do your due diligence and figure out if your SCN resistance source is working in your own fields.
Each year, AGVISE summarizes the SCN egg count that are submitted to our laboratories. The SCN summaries each year continue to demonstrate that the problem is not going away. A consistent SCN soil sampling program remains the best tool to monitor SCN populations. This is how we learn if current SCN management strategies like crop rotation and SCN-resistant varieties are working, or if you need to reevaluate your soybean management plan.
Additional Resources
The SCN Coalition Website
Iowa State University SCN Resource Compendium
SCN in Iowa: A Serious Problem that Warrants Renewed Attention (ISU Extension, June 2021)
AGVISE offers quick and reliable SCN egg count analysis. If you need to order SCN submission forms or supplies, you can order supplies from our online store.
Soybean cyst nematode: Failing resistance traits, increasing SCN populations
in Disease, Soybean/by Richard JennyOriginally featured in the Winter 2020-2021 AGVISE Laboratories Newsletter
In 2019, AGVISE Laboratories investigated if popular soybean varieties with PI88788 or Peking SCN-resistance traits were effectively providing protection from soybean cyst nematode (SCN) and found that a number of the varieties failed to do so. We expanded the project in 2020 with cooperation from agronomists in west-central Minnesota.
For over 20 years, PI88788 has been the primary SCN-resistance trait in over 95% of soybean varieties. In the past few years, university research is showing that PI88788 is losing its effectiveness at controlling SCN. Detecting SCN-resistant trait failure with the naked eye is impossible, unlike the detection of failed pesticide control, where you can still see a herbicide-resistant weed that is growing vigorously. Therefore, we wanted to demonstrate how you can measure SCN resistance with soil sampling, even though you cannot see it with your naked eye.
The project showed that SCN soil sampling in the early vs. late growing season was a simple way to detect a failing SCN resistance trait. The simple protocol only takes a big flag to mark the spot, then a set of soil samples in June and September to compare the SCN egg count results.
Feed Nitrate Testing in Drought Years
in Drought, Nitrogen, Plant Analysis/by John BrekerDrought is an unwelcome but well-known phenomenon on the Great Plains and Canadian Prairies. Sparse and scattered rainfall and above-average temperatures can cause significant stress in small grains and other crops. The same conditions also wrack pastures, prompting livestock producers to think about alternative feed options. As producers consider what to do with drought-stressed crops, whether to harvest for grain or feed to livestock, an important part of that decision will be the nitrate concentration of the plant material for livestock feed.
When drought-stressed annual crops (e.g., wheat, barley, oat, corn) are grazed or cut for hay or silage, producers must exercise caution about livestock nitrate poisoning when feeding drought-stressed forages to livestock. Drought-stressed crops often accumulate nitrate because plant uptake of nitrate exceeds plant growth and nitrogen utilization. Nitrate is usually concentrated in lower plant parts (lower stem or stalk). When livestock ingest forages with a high nitrate concentration, nitrate poisoning can occur. This is especially concerning for ruminant livestock like cattle and sheep.
When collecting plant material for nitrate analysis, collect the plant parts that the livestock will eat. If plant material will be grazed, recall that lower plant parts contain higher nitrate concentrations; monitor grazing height closely. If plant material will be cut and baled, you should collect plant material above the cutter bar height. Alternatively, plant material can be sampled with a hay probe after being baled.
Instructions for collecting and submitting a feed nitrate test
Photographic example of 1) cutting corn stalks at silage chopper height, 2) cutting the whole corn plants into 1- to 2-inch pieces and mixing well, and 3) placing one quart-sized subsample in AGVISE Plant Sample Bag.
It is wise to resample the baled hay or fermented silage before feeding to livestock. You need to know the nitrate concentration in the feed that is actually being fed to livestock, and you may need to blend it with other feed sources to dilute the nitrate concentration. For dry hay in bales, the nitrate concentration should not change in storage; use a hay probe to collect the best possible hay sample. For silage, the nitrate concentration may decrease 20 to 50% during the fermentation process, so a fresh sample is necessary before feeding.
AGVISE Laboratories offers next-day turnaround for feed nitrate analysis. Rapid turnaround on nitrate analysis is very important for producers debating to graze or cut and bale annual crops for livestock feed. AGVISE also provides livestock water analysis, which includes total dissolved solids, nitrate, and sulfate, to assess livestock drinking water quality. Water sources with high nitrate should also be considered in the total nitrate load for livestock rations.
Helpful resources on using drought-stressed crops for livestock feed
Nitrate Poisoning of Livestock, NDSU
Using Drought-stressed Corn as Forage, SDSU
Drought-related Issues in Forage, Silage, and Baleage, Univ. Missouri
Scouting Shorts: Soybean Iron Deficiency Chlorosis (IDC)
in Iron, Soybean/by John BrekerAs soybean plants emerge and add trifoliate leaves, keep your eyes peeled for soybean iron deficiency chlorosis (IDC). Through the upper Midwest and into the Canadian Prairies, soils with high pH and calcium carbonate pose a special problem for soybean plants and iron uptake. If you encounter soybean IDC, you will start to notice soybean plants with distinct interveinal chlorosis (yellow leaf with green leaf veins) in the newest leaves. The unifoliate leaves typically remain green.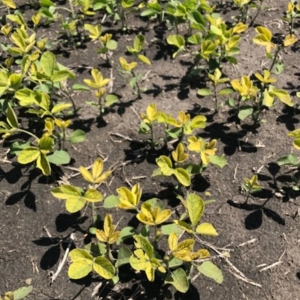
Look for characteristic symptoms of soybean IDC (above photo).
When to scout
Right now! Soybean IDC symptoms begin to appear as soybean plants enter the first- to third-trifoliate leaf stage. You will often see soybean IDC symptoms appear after a period of cool, wet weather.
Where to look
Soybean IDC symptoms are usually confined to soybean IDC hotspots with high carbonate and salinity. Soil pH is not a good indicator of soybean IDC risk because some high pH soils do not have high carbonate or salinity, which are the two principal risk factors. The soybean IDC hotspots often occur on landscape positions with moderate to poor drainage, but soybean IDC symptoms may appear across the entire field if high carbonate and salinity are present throughout the field. High residual soil nitrate-nitrogen can also make soybean IDC worse, so take an extra look at fields that were fallowed last year (e.g. Prevented Planting) and had higher soil nitrate-nitrogen than normal.
What soybean IDC can be confused with
Nitrogen deficiency: Pale green and yellowing is uniform across the entire leaf and veins (not interveinal like soybean IDC). Yellowing appears on older leaves. It is sometimes observed when poor inoculation or delayed nodulation occurs. Look at soybean roots for active nodules (bright pink-red center) or take plant and soil samples to confirm.
Potassium deficiency: Yellowing starts at the outer leaf margin, works its way inward with some brown mottling. Yellowing appears on older leaves during early growth stages and sometimes on upper leaves during pod fill. Take plant and soil samples to confirm.
Soybean cyst nematode (SCN): Aboveground symptoms are virtually invisible during the early growing season. Visual SCN symptoms only occasionally appear in late July or August, or if dry soil conditions occur. Look at soybean roots for small white-colored SCN cysts or take an SCN soil sample including infected root material to confirm.
More information on soybean IDC symptoms, causes, and management: https://www.agvise.com/soybean-iron-deficiency-chlorosis-symptoms-causes-and-management/