 Soil organic matter is a fundamental component of soil. It is comprised of living microorganisms, recently decomposed plant material, and stable humus organic compounds. Soil organic matter influences numerous biological, chemical, and physical properties of soil. It influences soil structure, water holding capacity, nutrient cycling, biological activity, and chemical fate and transport (e.g. pesticides). Soil organic matter is so important, you cannot really call something soil unless there is some organic matter present.
In the laboratory, soil organic matter can be measured via three different methods: Walkley-Black wet oxidation, estimation from organic carbon dry combustion, or loss-on-ignition (LOI) dry combustion. Each method has advantages and disadvantages. The LOI method is the routine method in commercial soil analysis.
Walkley-Black Wet Oxidation
The Walkley-Black wet oxidation method is the classic soil organic matter method developed in 1934. The method measures easily oxidizable carbon using sulfuric acid and potassium dichromate. The Walkley-Black method works very well on soils with low organic matter (<2.0%); however, the method is less suitable on soils with very high organic matter (>8.0%) as the dichromate reagent is consumed and may not oxidize all organic carbon. Soils with high chloride may interfere with the Walkley-Black method.
The Walkley-Black method has been phased out since the 1980s because the method requires hazardous chemicals and additional labor; therefore, the Walkley-Black method is more expensive than other methods. As the standard method, it is still required for some pesticide registration studies and regulatory soil characterization work.
Estimation from Organic Carbon Dry Combustion
Soil organic matter is a large complex organic compound containing hydrogen, oxygen, carbon, nitrogen, phosphorus, sulfur, and other elements. Soil organic matter contains about 58% organic carbon on average. We can estimate soil organic matter content from the amount of organic carbon measured in soil. Soil organic carbon is easily measured using a dry combustion carbon analyzer. The analyzer heats soil at high temperature to oxidize all carbon as carbon dioxide, which is then measured with an infrared detector. Since the method requires specialized instrumentation, it is more expensive than the LOI method.
The organic carbon dry combustion method is preferred in carbon sequestration research because organic carbon is measured directly. Estimating organic carbon from Walkley-Black or loss-on-ignition methods introduces unneeded calculation error.
For calcareous soils (pH > 7.3), inorganic carbon (carbonate) must also be analyzed. The dry combustion carbon analyzer measures total carbon, which combines inorganic and organic carbon. The inorganic carbon is measured separately, then subtracted from total carbon to calculate organic carbon.
Loss-on-Ignition Dry Combustion
The loss-on-ignition (LOI) dry combustion method is the routine soil organic matter method used in commercial soil analysis. The amount of soil organic matter is measured directly as the weight loss upon combustion at 360 deg C. The LOI method is simple, affordable, and safe. It also requires no hazardous chemicals. The method works well on soils with high organic matter content since there is no consumable reagent (like Walkley-Black method).
For soils containing hydrated salts (e.g. gypsum, CaSO4∙2H2O; Epsom salt, MgSO4∙7H2O), the LOI method may overestimate soil organic matter upon loss of water from hydrated salts. Soil is preheated at 105 deg C to remove structural water from clay minerals and hydrated salts, but some hydrated salts may retain water above the 105 deg C preheating process.
Soil organic matter affects various soil properties and processes. In return, various soil properties and soil formation factors affect soil organic matter.
Soil Texture
Soil clay particles protect soil organic matter from microbial decomposition (i.e. formation of protective clay-humus complexes). Soils with more clay generally have greater soil organic matter. In addition, soils with more clay also can store more plant available water, so plant biomass production and organic material addition to soil is greater.
Cation Exchange Capacity
Cation exchange capacity is derived from negative-charged soil particles, like clay minerals and soil organic matter. Soils with more soil organic matter will have higher cation exchange capacity.
Bulk Density
Bulk density is the amount of soil mass per unit volume. Soils with high bulk density may be compacted, which can inhibit plant root growth and exploration of the entire soil volume. A compacted soil also has less open pore space for air and water storage and movement in soil. Soil organic matter has low particle density, and it helps alleviate soil compaction and high bulk density. Soils with low bulk density likely contain high soil organic matter.
Water Holding Capacity
The amount of soil organic matter in soil is closely associated with soil texture and bulk density. The association also extends to water holding capacity. Like clay particles, soil organic matter has a lot of surface area on which water films can adhere, thus increasing the water holding capacity. Soils with more soil organic matter will hold more plant available water than soils with low organic matter.
Soil pH
Soil microorganisms breakdown soil organic matter into its constituent nutrient components; this is called nutrient cycling. The type and species of soil microorganism present depend on soil pH. In neutral to alkaline soils, the soil microorganism community is comprised of diverse bacteria and fungi to decompose soil organic matter. In acidic soils, the soil microorganism community is mostly fungi, so decomposition processes occur slower. In acidic soils, soil organic matter accumulates faster, producing soils with high soil organic matter. Soils with very alkaline pH also have reduced soil microorganisms activity and decomposition rates.
Soil Microorganism Biomass
Soil organic matter is the primary carbon food source for soil microorganisms. To maintain a high amount of soil microorganism biomass and biological activity, a significant amount of soil organic matter is required. Soils with low organic matter generally have reduced biological activity.
Split the Risk with In-season Nitrogen
in Canola, Corn, In-Season Fertilizer, Nitrogen, Sunflower, Water Quality, Wheat/by John BrekerFor some farmers, applying fertilizer in the fall is a standard practice. You can often take advantage of lower fertilizer prices, reduce the spring workload, and guarantee that fertilizer is applied before planting. As you work on developing your crop nutrition plan, you may want to consider saving a portion of the nitrogen budget for in-season nitrogen topdress or sidedress application.
Some farmers always include topdressing or sidedressing nitrogen as part of their crop nutrition plan. These farmers have witnessed too many years with high in-season nitrogen losses, usually on sandy or clayey soils, through nitrate leaching or denitrification. Split-applied nitrogen is one way to reduce early season nitrogen loss, but do not delay too long before rapid crop nitrogen uptake begins.
Short-season crops, like small grains or canola, develop quickly. Your window for topdress nitrogen is short, so earlier is better than later. To maximize yield in small grains, apply all topdress nitrogen before jointing (5-leaf stage). Any nitrogen applied after jointing will mostly go to grain protein. In canola, apply nitrogen during the rosette stage, before the 6-leaf stage. For topdressing, the most effective nitrogen sources are broadcast NBPT-treated urea (46-0-0) or urea-ammonium nitrate (UAN, 28-0-0) applied through streamer bar (limits leaf burn). Like any surface-applied urea or UAN, ammonia volatilization is a concern. An effective urease inhibitor (e.g. Agrotain, generic NBPT) offers about 7 to 10 days of protection before rain can hopefully incorporate the urea or UAN into soil.
Long-season crops, like corn or sunflower, offer more time. Rapid nitrogen uptake in corn does not begin until after V6 growth stage. The Pre-sidedress Soil Nitrate Test (PSNT), taken when corn is 6 to 12 inches tall, can help you decide the appropriate sidedress nitrogen rate. Topdress NBPT-treated urea is a quick and easy option when corn is small (before V6 growth stage). After corn reaches V10 growth stage, you should limit the topdress urea rate to less than 60 lb/acre (28 lb/acre nitrogen) to prevent whorl burn.
Sidedress nitrogen provides great flexibility in nitrogen sources and rates in row crops like corn, sugarbeet, or sunflower. Sidedress anhydrous ammonia can be safely injected between 30-inch rows. Anhydrous ammonia is not recommended in wet clay soils because the injection trenches do not seal well. Surface-dribbled or coulter-injected UAN can be applied on any soil texture. Surface-dribbled UAN is vulnerable to ammonia volatilization until you receive sufficient rain, so injecting UAN below the soil surface helps reduce ammonia loss. Injecting anhydrous ammonia or UAN below the soil surface also reduces contact with crop residue and potential nitrogen immobilization.
An effective in-season nitrogen program starts with planning. In years with substantial nitrogen loss, a planned in-season nitrogen application is usually more successful than a rescue application. If you are considering split-applied nitrogen for the first time, consider your options for nitrogen sources, application timing and workload, and application equipment. Split-applied nitrogen is another tool to reduce nitrogen loss risk and maximize yield potential.
Quality Control is First Priority for AGVISE
in Quality Control/by John LeeWhen you receive a soil test report from AGVISE you should expect the best. Since our start in 1976, our first priority has been providing you with the most accurate soil test data. Ensuring proper quality control and quality assurance (QC/QA) takes extra care and dedication from everyone at AGVISE to provide you with the best data possible.
Quality control in sample identification
Quality control in soil testing begins with a unique reference number/barcode on every sample bag. AGVISE will never ask you to write information on your soil sample bags. Deciphering unreadable handwriting is the first place mistakes happen. With the barcoded reference number on each sample bag, we track samples from the moment they arrive, through the analysis process, and when results are entered into AGVISOR, our online soil reporting system. AGVISE has used barcode reference numbers to identify soil samples for over 30 years. Since 2010, we have also offered online soil sample submission. The online submission system is another way to reduce errors because the customer can send the correct data directly to the laboratory. With online submission, there is no worry of misreading handwritten information!
When your soil samples arrive, we scan the barcode sticker and record its unique reference number, confirming it has reached the laboratory. Soil samples are dried overnight and ground the next morning. It is important to homogenize the soil sample through grinding and blending to ensure that what is analyzed represents the entire field, zone, or grid that was sampled.
Quality control in the laboratory
Soil analysis requires skilled technicians and calibrated instrumentation. Each soil analysis is done following accepted methods for soils in our region and supported by university soil test calibration research. When a soil test is performed (e.g. nitrate-nitrogen), quality control samples or “check samples” are tested along with customer samples to ensure accuracy and precision. The “check soil” has verified nutrient levels so we know what test value to expect every time. If a check soil value is outside the accepted range, all analysis from that group of samples is retested after the issue is corrected. A check soil is tested after every ten customer samples. Therefore, ten percent of all soil tests done in the laboratory each day are quality control samples! This past year, AGVISE used over 2,000 pounds of check soil in our quality control program to ensure you are receiving accurate data to make soil fertility decisions with.
Quality control – Laboratory proficiency and certification programs
AGVISE Laboratories in Northwood, ND and Benson, MN participate in three proficiency testing programs: the National Proficiency Testing program (NAPT), the Agriculture Laboratory Proficiency (ALP) program, and the Minnesota Department of Agriculture Manure Analysis Proficiency program. Our laboratories are also approved by the NAPT-Performance Assessment Program (PAP) and are certified soil and manure testing laboratories by the Minnesota Department of Agriculture. The Benson, MN laboratory is also an Iowa Department of Agriculture certified soil testing laboratory.
The proficiency programs send double-blind samples throughout the year to AGVISE. The samples are tested and results are evaluated by the proficiency programs for accuracy. Approval from PAP means that AGIVSE uses PAP approved methods to conduct soil analyses, which are required for NRCS programs. AGVISE has been involved with the NAPT proficiency testing program since it started in 1983. As a longtime participant, AGVISE has had committee representatives on the NAPT Oversight Board for many years, striving to make the program better each year.
Quality control has been and will continue to be a priority for AGVISE Laboratories. When you receive a soil test report from AGVISE, you can be sure you are receiving the most accurate data possible.
More information about soil test certification and proficiency programs:
Agricultural Laboratory Proficiency Program (ALP)
Iowa Department of Agriculture Certified Soil Testing Laboratories
Minnesota Department of Agriculture Certified Manure Testing Laboratories
Minnesota Department of Agriculture Certified Soil Testing Laboratories
North American Proficiency Testing Program (NAPT)
Performance Assessment Program (PAP)
AGVISE Potato Petiole Analysis: Informative, Accessible, and Easy-to-Understand Reports
in Nitrogen, Plant Analysis, Potato/by John LeeIrrigated potato production is an intensive cropping system. It requires proactive labor, critical decision-making tools, and well-timed nutrient management. There is a fine line between supplying adequate plant nutrition and applying too much, which could cause potato tuber defects like mishappen tubers or hollow heart, reducing the marketable potato yield.
Before seed potatoes go in the ground, potato agronomists begin with a good soil fertility plan based on precision soil sampling (grid or zone). Once potatoes have emerged, the next step is monitoring the soil and plant nutrient status to ensure the potato crop has no deficient or excess nutritional problems. The in-season monitoring is done with paired potato petiole and soil samples. The petiole and soil sampling starts about 30 days after emergence, then taken every week during the growing season.
A successful in-season potato monitoring program requires fast turnaround and reliable service on petiole and soil samples. This is where AGVISE Laboratories has excelled in serving the potato industry because we know the petiole and soil test results will be used immediately to make fertilizer and irrigation decisions on the fly. To make the data immediately available, the petiole and soil test results are posted online to the AGVISE website with next-day turnaround after the samples arrive at the laboratory.
It is also critical that the petiole and soil test results are easy to interpret and understandable to everyone on the agronomy staff. The AGVISE petiole and soil test report displays results in a graphic format, enabling agronomists to quickly evaluate plant nutrient levels and watch trends over the growing season. An example potato petiole and soil nutrient report is shown below. The report includes a weekly graph of petiole nitrate, phosphorus, and potassium alongside with soil ammonium- and nitrate-nitrogen.
For most irrigated potato producers, weekly potato petiole sampling is a given. But, an increasing number are also including soil samples for ammonium- and nitrate-nitrogen analysis each week. The soil nitrogen data is critical for timing an in-season nitrogen application. There are periods where very fast potato vegetative growth can cause unusually low petiole nitrate-nitrogen levels. The soil nitrogen data prevents overreaction to low petiole nitrate-nitrogen levels and avoids application of extra nitrogen, which could create potential tuber quality issues down the road.
AGVISE Laboratories has provided potato petiole and soil analysis services to the potato industry in the United States and Canada for over 40 years. In 2020, we analyzed over 12,000 potato petiole samples for potato growers at our Northwood, ND and Benson, MN laboratories. We know that timely information is important to our customers, and we are always making improvements to our service and support. If you have any questions, please talk with one of our agronomists or soil scientists about getting started with potato petiole analysis.
Soil Science Review: Soil pH, Acidity, and Alkalinity
in Soil Chemical Analysis, Soil pH/by John BrekerSoil pH is a basic soil property that affects many biological and chemical processes in soil. Simply knowing if a soil is acidic or alkaline can tell us a lot about how it behaves and how we can manage it. This is why soil pH is often called the master variable of biological and chemical reactions.
Soil pH is the activity of hydrogen ions (H+) in the soil solution, expressed on a logarithmic scale. A neutral soil has pH 7.0 and contains equal parts hydrogen (H+) and hydroxide (OH–) ions. An acidic soil has more H+ ions. An alkaline soil has more OH– ions. The relative acidity or alkalinity is shown in Table 1. In the laboratory, soil pH is analyzed using the 1:1 soil:water ratio routine method. Other soil pH methods include CaCl2, KCl, and saturated paste.
The optimal pH range for most plant species is near neutral or slightly acidic. In the optimal pH range, most plant nutrients are at or near their highest solubility in the soil solution. If soil pH is too low or too high, the availability of plant nutrients decreases; therefore, soil pH may be corrected with soil amendments or other strategies to mitigate reduced nutrient availability.
To demonstrate the importance of soil pH, let’s look at soil pH and aluminum. Aluminum is a natural component of soil clay particles, and it is insoluble above pH 5.5. In strongly acidic soils (pH < 5.5), aluminum solubility increases, so aluminum begins to dissolve and enter the soil solution. Soluble aluminum is very toxic to plant root growth and development, and it may cause reduced plant production or plant death. Soluble aluminum also binds with phosphate in the soil solution to create insoluble aluminum phosphate compounds, which then reduce soil phosphorus availability and plant uptake.
Soil acidity and aluminum toxicity is often the primary limitation of crop production in tropical and subtropical regions. Acidic soils are frequently amended with lime (calcium carbonate) to increase soil pH, improve nutrient availability, and increase crop production. On the glaciated plains of North America, soil acidity is not a common phenomenon. However, some localized areas of long-term no-till crop production on coarse-textured soils has produced more soils with very low pH (<5.0) and new aluminum toxicity problems.
Soil alkalinity similarly reduces the availability of plant nutrients in soil. In moderately alkaline soils (pH > 8.0), phosphorus binds with calcium to create insoluble calcium phosphate compounds, which then reduce soil phosphorus availability and plant uptake. Similarly, the micronutrients iron and zinc are less soluble. To improve nutrient availability in alkaline soils, farmers apply fertilizer in narrow bands. These bands decrease the volume of soil with which the fertilizer can react, thus keeping more nutrients available in the soil solution. It is generally uneconomical to lower alkaline soil pH to the optimal pH range in crop production.
Soil pH goes beyond inorganic soil chemistry. It also controls the biological activity of soil microorganisms that help create soil structure, cycle organic nutrients, and fix nitrogen in the nodules on legume roots. Soil pH also controls the degradation of many pesticides in soil. If there is something going on in soil, it probably starts with pH.
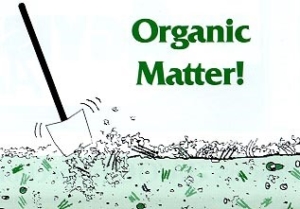
Soil Science Review: Organic Matter
in Soil Chemical Analysis, Soil Health/by John BrekerIn the laboratory, soil organic matter can be measured via three different methods: Walkley-Black wet oxidation, estimation from organic carbon dry combustion, or loss-on-ignition (LOI) dry combustion. Each method has advantages and disadvantages. The LOI method is the routine method in commercial soil analysis.
Walkley-Black Wet Oxidation
The Walkley-Black wet oxidation method is the classic soil organic matter method developed in 1934. The method measures easily oxidizable carbon using sulfuric acid and potassium dichromate. The Walkley-Black method works very well on soils with low organic matter (<2.0%); however, the method is less suitable on soils with very high organic matter (>8.0%) as the dichromate reagent is consumed and may not oxidize all organic carbon. Soils with high chloride may interfere with the Walkley-Black method.
The Walkley-Black method has been phased out since the 1980s because the method requires hazardous chemicals and additional labor; therefore, the Walkley-Black method is more expensive than other methods. As the standard method, it is still required for some pesticide registration studies and regulatory soil characterization work.
Estimation from Organic Carbon Dry Combustion
Soil organic matter is a large complex organic compound containing hydrogen, oxygen, carbon, nitrogen, phosphorus, sulfur, and other elements. Soil organic matter contains about 58% organic carbon on average. We can estimate soil organic matter content from the amount of organic carbon measured in soil. Soil organic carbon is easily measured using a dry combustion carbon analyzer. The analyzer heats soil at high temperature to oxidize all carbon as carbon dioxide, which is then measured with an infrared detector. Since the method requires specialized instrumentation, it is more expensive than the LOI method.
The organic carbon dry combustion method is preferred in carbon sequestration research because organic carbon is measured directly. Estimating organic carbon from Walkley-Black or loss-on-ignition methods introduces unneeded calculation error.
For calcareous soils (pH > 7.3), inorganic carbon (carbonate) must also be analyzed. The dry combustion carbon analyzer measures total carbon, which combines inorganic and organic carbon. The inorganic carbon is measured separately, then subtracted from total carbon to calculate organic carbon.
Loss-on-Ignition Dry Combustion
The loss-on-ignition (LOI) dry combustion method is the routine soil organic matter method used in commercial soil analysis. The amount of soil organic matter is measured directly as the weight loss upon combustion at 360 deg C. The LOI method is simple, affordable, and safe. It also requires no hazardous chemicals. The method works well on soils with high organic matter content since there is no consumable reagent (like Walkley-Black method).
For soils containing hydrated salts (e.g. gypsum, CaSO4∙2H2O; Epsom salt, MgSO4∙7H2O), the LOI method may overestimate soil organic matter upon loss of water from hydrated salts. Soil is preheated at 105 deg C to remove structural water from clay minerals and hydrated salts, but some hydrated salts may retain water above the 105 deg C preheating process.
Soil organic matter affects various soil properties and processes. In return, various soil properties and soil formation factors affect soil organic matter.
Soil Texture
Soil clay particles protect soil organic matter from microbial decomposition (i.e. formation of protective clay-humus complexes). Soils with more clay generally have greater soil organic matter. In addition, soils with more clay also can store more plant available water, so plant biomass production and organic material addition to soil is greater.
Cation Exchange Capacity
Cation exchange capacity is derived from negative-charged soil particles, like clay minerals and soil organic matter. Soils with more soil organic matter will have higher cation exchange capacity.
Bulk Density
Bulk density is the amount of soil mass per unit volume. Soils with high bulk density may be compacted, which can inhibit plant root growth and exploration of the entire soil volume. A compacted soil also has less open pore space for air and water storage and movement in soil. Soil organic matter has low particle density, and it helps alleviate soil compaction and high bulk density. Soils with low bulk density likely contain high soil organic matter.
Water Holding Capacity
The amount of soil organic matter in soil is closely associated with soil texture and bulk density. The association also extends to water holding capacity. Like clay particles, soil organic matter has a lot of surface area on which water films can adhere, thus increasing the water holding capacity. Soils with more soil organic matter will hold more plant available water than soils with low organic matter.
Soil pH
Soil microorganisms breakdown soil organic matter into its constituent nutrient components; this is called nutrient cycling. The type and species of soil microorganism present depend on soil pH. In neutral to alkaline soils, the soil microorganism community is comprised of diverse bacteria and fungi to decompose soil organic matter. In acidic soils, the soil microorganism community is mostly fungi, so decomposition processes occur slower. In acidic soils, soil organic matter accumulates faster, producing soils with high soil organic matter. Soils with very alkaline pH also have reduced soil microorganisms activity and decomposition rates.
Soil Microorganism Biomass
Soil organic matter is the primary carbon food source for soil microorganisms. To maintain a high amount of soil microorganism biomass and biological activity, a significant amount of soil organic matter is required. Soils with low organic matter generally have reduced biological activity.
Phosphorus and the 4Rs: The progress we have made
in Fertilizer Placement, Phosphorus, Regional Data, Water Quality/by John BrekerThe year 2019 marked the 350th anniversary of discovering phosphorus, an element required for all life on Earth and an essential plant nutrient in crop production. Over the years, we have fallen in and out of love with phosphorus as a necessary crop input and an unwanted water pollutant. Through improved knowledge and technologies, we have made great progress in phosphorus management in crop production. Let’s take a look at our accomplishments!
Right Rate
Phosphorus fertilizer need and amount is determined through soil testing, based on regionally calibrated soil test levels for each crop. Soils with low soil test phosphorus require more fertilizer to optimize crop production, whereas soils with excess soil test phosphorus may only require a starter rate. Across the upper Midwest and northern Great Plains, soil testing shows that our crops generally need MORE phosphorus to optimize crop yield (Figure 1), particularly as crop yield and crop phosphorus removal in grain has increased. Since plant-available phosphorus varies across any field, precision soil sampling (grid or zone) allows us to vary fertilizer rates to better meet crop phosphorus requirements in different parts of the field.
Figure 1. Soil samples with soil test phosphorus below 15 ppm critical level (Olsen P) across the upper Midwest and northern Great Plains in 2019.
Right Source
Nearly all phosphorus fertilizer materials sold in the upper Midwest and northern Great Plains are some ammoniated phosphate source, which has better plant availability in calcareous soils. Monoammonium phosphate (MAP, 11-52-0) is the most common dry source and convenient as a broadcast or seed-placed fertilizer. Some new phosphate products also include sulfur and micronutrients in the fertilizer granule, helping improve nutrient distribution and handling. The most common fluid source is ammonium polyphosphate (APP, 10-34-0), which usually contains about 75% polyphosphate and 25% orthophosphate that is available for immediate plant uptake. Liquid polyphosphate has the impressive ability to carry 2% zinc in solution, whereas pure orthophosphate can only carry 0.05% zinc. Such fertilizer product synergies help optimize phosphorus and micronutrient use efficiency.
Right Time
Soils of the northern Great Plains are often cold in spring, and early season plant phosphorus uptake can be limited to new seedlings and their small root systems. We apply phosphorus before or at planting to ensure adequate plant-available phosphorus to young plants and foster strong plant development. In-season phosphorus is rarely effective as a preventive or corrective strategy.
Right Place
Proper phosphorus placement depends on your system and goals. Broadcasting phosphorus fertilizer followed by incorporation allows quick application and uniform distribution of high phosphorus rates. This strategy works well if you are building soil test phosphorus in conventional till systems. In no-till systems, broadcast phosphorus without incorporation is not ideal because soluble phosphorus left on the surface can move with runoff to water bodies.
In no-till systems, subsurface banded phosphorus is more popular because phosphorus is placed below the soil surface, thus less vulnerable to runoff losses. In general, banded phosphorus is more efficient than broadcast phosphorus. In the concentrated fertilizer band, less soil reacts with the fertilizer granules, thus reducing phosphorus fixation, allowing improved plant phosphorus uptake. Some planting equipment configurations have the ability to place fertilizer near or with seed, which further optimizes fertilizer placement and timing for young plants.
For more information on 4R phosphorus management, please read this excellent open-access review article: Grant, C.A., and D.N. Flaten. 2019. J. Environ. Qual. 48(5):1356–1369.
Soil Science Review: Cation Exchange Capacity
in Soil Chemical Analysis/by John BrekerEach year, AGVISE Laboratories delivers thousands of soil characterization reports with something printed on them called, “Cation Exchange Capacity (CEC).” Unless you have some background in soil science or surface chemistry, the number might be a mystery to you. Cation exchange capacity is the amount of positive-charged cations (e.g. ammonium, calcium, hydrogen, magnesium, potassium, sodium) held on negative-charged soil particles, like clay and organic matter.
Soil particles have negative charge on their surfaces and edges. Since soil particles have negative charge and the cations have positive charge, the two are attracted together like magnets. If the positive-charged cations are held on the negative-charged soil particles, then the ion cannot leach through the soil profile with soil water. Therefore, the amount of positive-charged cations that are held on negative-charged soil particles is the cation exchange capacity (CEC). The CEC reporting units are centimole of charge per 1 kilogram soil (cmolc/kg) or milliequivalent per 100 gram soil (meq/100 g). The units are numerically equivalent, so a soil with CEC 20 cmolc/kg is equal to 20 meq/100 g.
Soils with high CEC are generally more fertile and can provide plants with more nutrients and water. A soil with high CEC (>25 cmolc/kg) can hold many cation nutrients and likely contains a high amount of clay and/or organic matter. A soil with low CEC (<5 cmolc/kg) cannot hold many cation nutrients, and it is likely sandy with little organic matter.
The CEC measurement can also provide information about the fate and transport of other charged compounds in the soil solution, like pesticides. Pesticides with positive charge are bound more tightly to soil particles if CEC is high. Sandy soils with low CEC often cannot hold onto positive-charged pesticides, meaning that pesticide may be prone to leaching.
There are different laboratory methods to measure CEC of soil. The most common method in commercial soil testing is the summation method, where all extractable cations on soil particles are summed together. The cations are extracted with ammonium acetate, then analyzed with atomic absorption spectroscopy (AAS) or inductively coupled plasma atomic emission spectroscopy (ICP-AES). The extracted cations are then added together to calculate CEC. The routine method works well on most soils; however, it does not do work well on soils with salinity or calcium carbonate (pH > 7.3). The ammonium acetate extraction also dissolves cations contained in soluble salts and calcium carbonate minerals. These cations are not held on cation exchange sites (i.e. cation exchange capacity), but they are still included in the CEC measurement, creating an inflated and inaccurate CEC result.
To obtain accurate CEC results on soils with salinity or calcium carbonate, the saturation-displacement CEC method is appropriate. The method first saturates all cation exchange sites with one cation (either ammonium or sodium) and washes away all other cations. The second step displaces the target cation to obtain the accurate CEC measurement. The saturation-displacement CEC method involves more work and cost than the routine summation method. You should talk with a soil scientist to help you decide which laboratory method is required to obtain an accurate CEC result.
Molybdenum: The Micro-est of Micronutrients
in Molybdenum, Plant Analysis, Soil Chemical Analysis/by John BrekerMolybdenum (Mo) is an essential plant nutrient, necessary for nitrate assimilation and biological nitrogen fixation. Legumes, relying on symbiotic nitrogen fixation, have greater Mo requirement than non-legumes. Nevertheless, the Mo requirement of plants is the lowest among all micronutrients, with critical deficiency concentrations ranging from 0.1 to 1.0 ppm in plant leaves. The very low Mo concentration lies near the detection limit for most laboratory instruments used in commercial soil and plant analysis, so you may see Mo concentration reported as “below instrument detection limit.”
Plant-available Mo in soil is present as molybdate (MoO42-). Unlike most other micronutrients, molybdate availability in soil increases with soil pH. On soils with pH greater than 6.0, Mo deficiency is exceptionally rare. In the northern Great Plains and Canadian Prairies where most soils have high pH, Mo deficiency is virtually unknown, and background plant Mo concentration in legumes ranges from 4 to 8 ppm, indicating that plants obtain sufficient Mo from soil naturally. In the upper Midwest where low pH soils are more common, crop response to Mo fertilization has been limited to legume crops grown on strongly acidic, sandy or peat soils.
Since Mo deficiency is so uncommon and most soils are limed above pH 6.0, no reliable plant-available soil test method for Mo has been developed in the region. The acid ammonium oxalate method was infrequently used in the southeast United States, but the prediction of crop response to Mo fertilization aligns more closely with soil pH than soil test Mo. If soil pH is less than 6.0 and Mo fertilization is necessary, a molybdate fertilizer seed treatment or foliar application is usually sufficient. Overapplication of Mo fertilizer is not a concern for grain production. In forage production however, overapplication is a serious concern because excessive Mo in forages can cause Mo-induced copper deficiency (molybdenosis) in ruminant livestock.
Fertilizing soybean
in Iron, Nitrogen, Phosphorus, Potassium, Soybean, Sulfur, Zinc/by Richard JennySoybean acres expanded greatly across the northern Great Plains and into Manitoba through the 1990s and 2000s. Today, soybean occupies a large portion of planted acres and makes a desirable rotation crop in canola, corn, and small grain production systems. As soybean has advanced northward and westward, soybean is often billed as a low maintenance crop, requiring no fertilizer or even seed inoculation. The fact is, if you expect soybean to be a low maintenance crop, you can expect low yield results. Achieving high soybean yields starts with a good, long-term soil fertility plan.
Nitrogen
Soybean yielding 40 bu/acre requires about 200 lb/acre nitrogen, but luckily you do not have to provide all the nitrogen! Soybean relies on nitrogen-fixing bacteria to meet its nitrogen requirements. Legumes, like soybean, form a symbiotic relationship with N-fixing bacteria, housed in root nodules, to provide sufficient nitrogen. Each legume species requires a unique N-fixing bacterium, thus an inoculant for lentil or pea does not work on soybean. Soybean seed must be inoculated with the N-fixing bacteria Bradyrhizobia japonicum. Ensure you have the proper soybean-specific seed inoculant. You can count the number of nodules on soybean roots and verify the presence of active N-fixing bacteria in the nodules with bright pink centers. These soybean plants have enough active N-fixing bacteria to meet soybean nitrogen requirements.
For new soybean growers, the N-fixing bacteria Bradyrhizobia japonicum is not naturally present in soil and seed inoculation is required. During the first few years of soybean establishment, supplemental nitrogen may be required to achieve good soybean yield while the N-fixing bacteria population builds. University of Minnesota researchers in the northern Red River Valley showed that soils with less than 75 lb/acre nitrate-N (0-24 inch) required 40-50 lb/acre additional preplant nitrogen. If successful inoculation and good nodule counts are observed in the first year, then no additional nitrogen should be required in subsequent years.
Plant soybean on soils with less than 100 lb/acre nitrate-N (0-24 inch), if possible. High residual soil nitrate may delay root nodulation with N-fixing bacteria and increase the severity of iron deficiency chlorosis (IDC). Because soybean can fix its own nitrogen, you may recoup better economic return on soils with high residual nitrate with crops that do not fix their own nitrogen like corn or wheat.
Phosphorus
Soybean does not respond to phosphorus as dramatically as grass crops like corn or wheat do. Nevertheless, medium to high soil test P are required to achieve good soybean yields. Soybean responds to broadcast P placement better than seed-placed or sideband P. In dryland regions where soybean is planted with air drills, seed-placed P or sideband P is often the only opportunity to apply phosphorus. You must pay special attention to seed-placed fertilizer safety with soybean. An air drill with narrow row spacing (6 inch) should not exceed 20 lb/acre P2O5 (40 lb/acre monoammonium phosphate, MAP, 11-52-0). Fertilizer rates exceeding the seed safety limit may delay seedling emergence and reduce plant population. For wider row spacings, no fertilizer should be placed with seed.
Potassium
Soybean removes far more potassium in harvested seed than canola or wheat. Soybean yielding 40 bu/acre removes about 60 lb/acre K2O, while wheat yielding 60 bu/acre removes only 20 lb/acre K2O. Pay close attention to potassium removal across the crop rotation. After soybean is added to the crop rotation, cumulative potassium removal greatly increases, and declining soil test K is observed over time.
Do not place potassium with soybean seed; delayed seedling emergence and reduced plant population can occur. Any potassium fertilizer should be broadcasted or banded away from seed.
Sulfur
Sulfur deficiency in soybean is uncommon, yet sometimes observed on coarse-textured soils with low organic matter (< 3.0%). Soybean response to sulfur is usually confined to certain zones within fields. With additional sulfur, soybean can produce more vegetative growth, but more vegetative growth may increase soybean disease severity, such as white mold. The residual sulfur remaining after sulfur-fertilized canola, corn, or small grain is often sufficient to meet soybean sulfur requirements.
Iron
Soybean is very susceptible to iron deficiency chlorosis (IDC). Soybean IDC is not caused by low soil iron but instead by soil conditions that decrease iron uptake by soybean roots. Soybean IDC risk and severity are primarily related to soil carbonate content (calcium carbonate equivalent, CCE) and worsened by salinity (electrical conductivity, EC).
Soybean IDC is common in the upper Midwest, northern Great Plains, and Canadian Prairies, where soils frequently have high carbonate and/or salinity. Within a field, IDC symptoms are usually confined to soybean IDC hotspots with high carbonate and salinity; however, symptoms may appear across a field if high carbonate and salinity are present throughout the field. Soybean IDC severity is made worse in cool, wet soils and soils with high residual nitrate. Soil pH is not a good indicator of soybean IDC risk because some high pH soils lack high carbonate and salinity, which are the two principal risk factors.
Guidelines for managing soybean IDC:
Zinc
Zinc deficiency in soybean is rare, even on soils with low soil test Zn. Soybean seed yield response to zinc is limited on soils with less than 0.5 ppm Zn. More zinc sensitive crops like corn, dry bean, flax, and potato will respond to zinc on soils with less than 1.0 ppm Zn. If zinc sensitive crops also exist in the crop rotation, you may apply zinc with broadcast phosphorus or potassium during the soybean year as another opportunity to build soil test Zn across the crop rotation.
Copper for Small Grains
in Copper, Disease, Wheat/by John LeeAmong crops grown in the northern Great Plains, small grains (cereals) are the most susceptible to copper deficiency. Copper (Cu) is an essential micronutrient required in small concentrations for plant growth and reproduction. Copper deficiency symptoms in cereals include pale yellowing, wilted and twisted leaf tips, and malformed seed heads. Severe copper deficiency will stop plant growth and kill plants during tiller formation. During pollination, copper deficiency will cause florets to remain partially open. This creates a vulnerable period for diseases, such as Fusarium head blight (head scab) and ergot, to infect the seed head and reduce grain yield.
Small grains sensitive to copper deficiency include barley, oat, rye, triticale, and wheat (including durum, spring, and winter types). Copper deficiency is most common on soils with less than 0.5 ppm Cu. Soils with low soil test Cu frequently include sandy soils with low organic matter (<3.0%) and organic soils (peat) with very high organic matter (>10%). Between soil and plant analysis, diagnosing copper deficiency with soil analysis is the most predictive. Plant analysis is less helpful because the plant Cu concentrations in sufficient and deficient plants are very close.
The most effective strategy to build soil test Cu on mineral soils is to broadcast-incorporate copper sulfate (25% Cu). building soil test Cu for many years. Do not mix copper sulfate with seed-placed dry fertilizer blends for air drills; copper sulfate is a hygroscopic (water holding) material that makes blending difficult and bridging is a concern. For seed-placed copper, use a liquid copper source injected in furrow. Liquid copper sources include dissolved copper sulfate and various chelated Cu products.
On organic soils, soil test Cu is difficult to build as copper readily forms complexes with soil organic matter. To reduce copper complexation, apply seed-placed liquid copper at planting and follow with foliar copper in the first herbicide application. Liquid copper sources include dissolved copper sulfate and various chelated Cu products.