This article originally appeared in the AGVISE Laboratories Winter 2022 Newsletter
Farmers, like all business owners, are profit maximizers: things are good when revenue exceeds cost. Things are even better when the difference between revenue and costs is substantial. The math behind increasing profit is simple: reduce costs, increase revenue. But, the difficult part is finding and implementing strategies on the farm to do this. Why not start with fertilizer, which is typically the largest annual input cost on the farm?
Your fields are variable. You know the hilltops have lower crop yields than the mid-slopes, and you know exactly how far the saline spots creep into the more productive part of the field. So why use the same rate of fertilizer in the unproductive areas as you would in the productive areas? Optimize your fertilizer inputs by reducing rates in low-yielding areas and reallocate those fertilizer dollars to the productive ground.
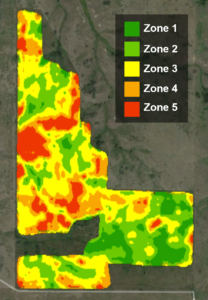
Figure 1. North Field zone map, created using ADMS from GK Technology.
How does one actually do this? Creating zone maps for your fields, soil sampling and testing based on productivity zones, and variable rate (VRT) fertilizer application is the place to start. Applying VRT fertilizer allows you to apply fertilizer where it is needed and not waste fertilizer dollars where it is not. Let me show you an example from my family’s farm in western North Dakota.
I farm with my dad and brother in southwest North Dakota. This past fall, I created zone maps for each of our fields, with help from GK Technology and their ADMS program. The final maps are based on historical satellite imagery. I will show you one of our fields, the North Field, and take a deep dive on nitrogen fertilizer optimization using zone soil sampling and VRT fertilization in the dryland “out west” country.
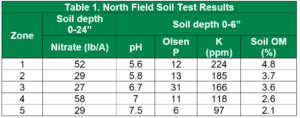
The North Field (Figure 1) is variable. That is expected on a 120-acre field with many hills and ravines (Table 1). For discussion, we will use residual soil nitrate-nitrogen results and make a nitrogen fertilizer plan using urea for hard red spring wheat (HRSW) in 2022. You can see the soil nitrogen data, crop yield goals, and final nitrogen rates in Table 2.
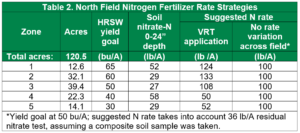
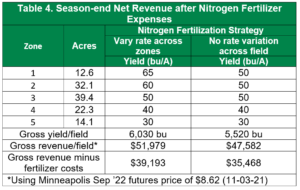
The first place to optimize fertilizer inputs is setting realistic crop yield goals for each zone. Spring wheat yield goals range from 65 bushel/ acre in the best zone (zone 1) to 30 bushel/acre on the hilltops (zone 5). Adjusting the nitrogen rate for the proper crop yield goal ensures that the high-producing zones are not limited by lack of nitrogen (increased fertilizer cost, increased revenue) and the low-producing zones are not overfertilized (decreased fertilizer cost, same revenue). With a responsible crop yield goal on the low-producing zones, the crop still receives the amount of nitrogen it requires, and excess nitrogen is not lost to nitrate leaching (wasted input cost). As a result, the excess nitrogen fertilizer is reallocated to high-producing zones, resulting in more crop yield with the same total fertilizer budget, and increased revenue.
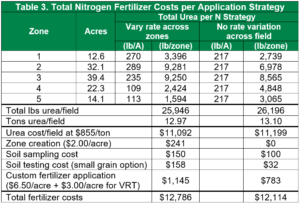
The nitrogen fertilizer scenarios in Tables 3 and 4 break down the projected revenues and expenses, demonstrating the benefits of zone soil sampling and VRT fertilization. For the North Field on my farm, the projected profit increase was $3,725 for the field or $31.05 per acre. It is tough to argue with a dollar amount like that! Prices will vary, of course, for fertilizer and precision ag services in your geography. Do the math for yourself and see how zone soil sampling and VRT fertilization can maximize profits for you.
Early Soil Nitrate Trends after Wheat in 2022
in Nitrogen, Regional Data, Wheat/by John BrekerSmall grain harvest is well underway across the region, and soil testing is progressing quickly. Crop yields have varied from below average to exceeding expectations across the region and often in the same area. Planting date, summer temperatures, and rainfall (too little or too much) were major factors this year.
The major factors influencing the amount of residual soil nitrate-N after crops are:
1. Nitrogen fertilizer rate: too high or too low
2. Crop yield achieved: much lower or higher than expected
3. Nitrogen losses: denitrification and leaching after too much rainfall
4. Nitrogen mineralization from organic matter: cool or warm growing season
Seasonal weather is a large driving factor in the amount of nitrate-N in the soil profile. This changes from field to field and year to year. Early spring weather conditions were very wet across much of the region. In June and July, some areas continued to receive adequate to excess rainfall. Meanwhile, other areas received very little rain in the late growing season.
AGVISE has tested over 10,000 soil samples from wheat fields across the region. The table below indicates the percentage of soil samples in each soil nitrate-nitrogen category in several areas of Manitoba, Minnesota, North Dakota, and South Dakota. The data should give you a general idea of how variable residual soil nitrate is from field to field in each region. With such variable crop yields, there is quite a bit of variability in residual nitrate following wheat in the region. In drought-affected areas of Minnesota, North Dakota, and South Dakota, over 10 to 20% of soil samples have more than 60 lb/acre nitrate-N (0-24 inch soil profile) remaining after wheat.
For Prevented Planting or unseeded acres, the factors above plus some additional factors will affect the amount of residual nitrate-nitrogen:
1. How long was water standing on the field?
2. Was weed growth controlled, early or late?
3. Was tillage used? How many times? How deep?
4. Was a cover crop planted? What amount of growth was achieved?
When submitting soil samples from fields that were not planted, please choose “Fallow” or “Cover Crop” as the previous crop. This will allow us to send additional information on soil nitrate trends for unseeded and cover crop fields once we get enough data.
As the fall soil testing season continues, we will keep you updated. If you have any questions, please call our experienced agronomic staff. We hope you have a safe harvest and soil testing season.
Corn Growth and Development – Are we behind?
in Corn/by Brent JaenischThis article originally appeared in the AGVISE Laboratories Fall 2022 Newsletter under Southern Trends
The spring and early summer were very interesting to say the least. Spring rains continued well into late May and delayed planting for sugar beet, corn, and soybean throughout the southern region. By mid-May, many producers changed long-day corn maturities to earlier corn maturities. In the Benson, MN neighborhood, corn planting finally got underway around May 20 (60% planted) and near completion on June 5 (93% planted). Around the coffee shop, many people have commented, “How far behind is the corn crop in 2022?” So, let’s put some numbers to this question.
The High Plains Regional Climate Center has a nice growing degree day (GDD) calculator for simulations of corn growth and development (https://hprcc.unl.edu/agroclimate/gdd.php). I made a few GDD simulations for previous years, comparing 2022 with 2019 (a below-average GDD year) and 2021 (an incredible GDD year). As of mid-July, the 2022 growing season was 3 days ahead of 2019 (63 more GDD) and 9 days behind 2021 (182 fewer GDD). A corn plant takes about three days to make a new leaf when the corn plant is V12 and younger, so you can guesstimate that we were about 3 leaf stages behind 2021.
With the late spring planting window, many corn producers around Benson, MN opted for corn maturities about 6 to 8 days earlier than normal. If you compare an earlier 92-day corn maturity with a more typical 100-day corn maturity, the required GDD to blacklayer is 2207 and 2401 GDD, respectively. We generally accumulate 20-30 GDD per day in midsummer. If either corn maturity was planted on May 20, the estimated silking (R1 stage) date is July 21 for the 92-day maturity and July 25 for the 100-day maturity, a difference of four days. Similarly, the estimated blacklayer (R6 stage) date is September 18 for the 92-day maturity and October 12 for the 100-day maturity, a difference of 24 days. Toward the end of the growing season when fewer GDD are accumulated per day, the difference in maturity groups really starts to show. Warmer than average temperatures will shorten that difference, but only time will tell if the right decision was to plant earlier corn maturities.
Nielsen, R. L. The Planting Date Conundrum. Corny News Network, Apr. 2022. Purdue Univ., West Lafayette, IN. https://www.agry.purdue.edu/ext/corn/news/timeless/pltdatecornyld.html
To help drive home the point about planting date and final corn grain yield, I really like the graph from Dr. Bob Nielsen at Purdue University (figure above). Early planting does not always result in very high corn yield, and late planting does not always result in very low corn yield. In 2022, late planting will limit top-end crop yield potential, but the final crop yield could still be good as long as GDD accumulation remains above average. As always, Mother Nature will be the final determinant in setting the final crop yield.
Sampling Depth: Be consistent!
in Soil Sampling/by Jodi BoeThis article originally appeared in the AGVISE Laboratories Fall 2022 Newsletter
Soil test results are only as reliable as the soil samples collected in the field. A crucial part of soil sample quality is consistent sampling depth. This is important because all the soil test calibration research and fertilizer guidelines for non-mobile nutrients (e.g., phosphorus, potassium, zinc) are based on a soil core depth of 0-6 inches, thanks to the historical tillage depth. If soil cores are taken too shallow or too deep, you can skew soil test values and the resulting fertilizer guidelines. Getting the most accurate and useful fertilizer guidelines starts with a good quality soil sample. To help illustrate this point, we did a simple demonstration project, showing how soil sampling depth consistency affects soil test results in a long-term no-till and conventional-till field.
Soil nutrient concentrations can vary greatly throughout a soil profile, even more so in long-term no-till where soil nutrients are not regularly mixed. This leads to stratification of nutrients near the soil surface, meaning a soil core that is too shallow or too deep can greatly affect soil test results. You can clearly see the effect of no-till stratification in soil test potassium (STK) levels in Table 1. Between the 0-2 and 0-4 inch soil cores, there is a 53 ppm difference in STK. Although nutrients in conventional tillage systems do not concentrate at the surface to the extent they do in no-till, a concentration gradient still exists. This is most obvious near the tillage depth, where soil mixing below that depth stops. In Table 2, the 0-2 and 0-4 inch soil test results are similar, but the differences become apparent at the 0-6 inch depth. Soil sample depth is just as critical in conventional tillage as it is in no-till. In addition, it is important to collect soil samples before any fall tillage occurs
to collect good quality soil cores with consistent depth. Tillage creates uneven clods and a “fluffy” soil surface, making it hard to determine what actually represents the 0-6 inch soil depth.
Tips to increase soil sample depth consistency
• Collect soil samples before any tillage occurs. If tillage does happen before you can take a soil sample, try to make a firm surface with your foot or sample in a tire track.
• If you are using a hand probe, mark the target soil core depth on the soil probe clearly. A metal file works great to cut a notch in the soil probe at 6 inches. The file mark does not wear away like a piece of tape or permanent marker can.
• If you are using a hydraulic probe and use your hand to measure the soil core length, calibrate often to ensure you are measuring a true 0-6 inch soil core.
• If you train new soil samplers, reiterate the importance of soil sampling depth consistency. Provide clear instructions on measuring the proper soil sampling depth in the field.
• Be sure the soil sample submission information sent to the laboratory (online or paper) matches the actual soil sample depth obtained in the field. The correct soil sample depth can be noted on the paper forms or edited on the AGVISOR online submission before it reaches the laboratory.
Prevented Planting Acres? What to do for 2023
in Nitrogen, Prevented Planting/by John BrekerThis article originally appeared in the AGVISE Laboratories Fall 2022 Newsletter
Good crop prices encouraged late planting beyond crop insurance deadlines, but additional June rainfall kept some producers from planting all their acres, leaving some unplanted fields or unplanted parts of fields. There are many questions about soil testing on these unplanted fields: When should you start soil sampling? What kind of residual soil nitrate-nitrogen amounts can you expect? The extremely wet soil conditions may have caused considerable soil nitrogen losses to leaching or denitrification. Through summer, warmer and drier weather added nitrogen through mineralization of soil organic matter. In addition, cover crops and any weedy growth will acquire nitrogen from soil. The amount of soil nitrate-nitrogen remaining for next year will depend on soil type, environment, and management factors, which vary from field to field and zone to zone.
Management Factors
• What was the crop grown in the previous year?
• What was the nitrogen fertilizer rate and application timing? Was it applied last fall?
• Did you do any summer tillage? More tillage promotes nitrogen mineralization.
• How was your weed control? Did the weeds get large and acquire substantial nitrogen?
• Did you plant a cover crop? Did the cover crop get incorporated later?
Environmental Factors
• Did excessive rainfall cause nitrate leaching on well-drained soils?
• Did excessive rainfall cause denitrification on poorly drained soils?
• Were summer temperatures warm? Warm temperatures promote N mineralization.
Soil testing on these unplanted fields can begin as soon as good quality soil samples can be collected after mid-August. There is no reliable way to guess how much residual soil nitrate may be present in these unplanted fields or unplanted parts of fields. Soil testing is the only accurate way to learn how much residual soil nitrate remains in the soil profile. To obtain the best information for nitrogen management, we recommend splitting fields into management zones for soil testing. The unplanted field areas can vary considerably from the rest of the field, which will skew the field-average soil test result and resulting nitrogen fertilizer rate.
Soil Sampling for Nitrogen in a Delayed Spring
in In-Season Fertilizer, Nitrogen, Soil Sampling/by John BrekerSpring planting is clipping along in some parts of the region, while other parts are still waiting to hit the field, as excessive rainfall and cold temperatures have delayed spring field work and planting. Who would have thought last fall that this is what spring 2022 would look like, after the worst region-wide drought in 30 years? Mother Nature always reminds us to stay prepared for anything.
A delayed spring start means that every day in the field is important. AGVISE delivers next-day turnaround on processing soil samples. The soil samples are analyzed and reported the next business day after arrival at the laboratory. Soil test results are posted to our online AGVISOR portal for quick and easy access. If you need any soil sampling supplies for spring, please let us know and we will send them to you right away.
So, what is the best strategy for spring soil testing and assessing soil nitrogen losses after the rain? The compressed fertilizer and planting window might not leave enough time to adjust preplant fertilizer rates, especially if the field is just barely dry enough to plant. If soil nitrogen losses have occurred following spring rains, a spring soil test collected now will be helpful to create a split-applied nitrogen plan or to direct a supplemental nitrogen application later. In the AGVISE Spring 2022 Newsletter, we answered some questions on split-applied nitrogen application strategies, so please take a look at those options for applying nitrogen during the growing season.
Short-season crops develop quickly, so additional nitrogen should be applied in the upcoming weeks. A soil sample collected before or shortly after planting will provide the best assessment of preplant soil nitrogen supply and losses. Do not wait too long to collect the soil sample because, as we move into June, plant nitrogen uptake and nitrogen mineralization from soil organic matter will make the soil nitrogen result more difficult to decipher. To maximize yield in small grains, apply all topdress nitrogen before jointing (5-leaf stage). Any nitrogen applied after jointing will mostly go to grain protein. In canola, apply nitrogen during the rosette stage, before the 6-leaf stage.
Long-season crops like corn offer more flexibility and time for in-season soil sampling and nitrogen application. Rapid nitrogen uptake in corn does not begin until after the V6 growth stage. The Pre-sidedress Soil Nitrate Test (PSNT) can help you decide the appropriate sidedress nitrogen rate. For more details, take a look at the PSNT article link for instructions on collecting and submitting PSNT soil samples. The PSNT requires a 0-12 inch depth soil sample taken when corn plants are 6 to 12 inches tall (at the whorl), usually in late May or early June. Late-planted corn may not reach that height before mid-June, but PSNT soil samples should still be collected during the first two weeks of June. If spring rainfall was above normal, Iowa State University guidelines provide additional PSNT interpretation criteria for excessive rainfall, manured soils, and corn after alfalfa.
If you have any questions on the best strategies for spring soil sampling and in-season nitrogen application options, please call our technical support team and we will be happy to answer any questions you may have.
Probe stuck in the ground? Don’t let it wreck your day.
in Equipment, Troubleshooting/by John LeeIf you have ever had a soil probe come off while in the ground, you have experienced a rare but stressful event!
A customer recently called with this situation and a success story about how he recovered the soil probe “MacGyver” style. I think his solution involved barb wire, duct tape and some chewing gum. While a soil probe with quicktatch collar can come off the roll pin on the cylinder shaft, it is very rare. If you have had that happen to you, you may have used a shovel to dig the probe out or pulled it out with some other MacGyver device you created. In the winter with frozen soil, your options are more limited. We wanted to give others who may experience this rare event an idea to create your own “probe puller” if this happens to you. The materials you need are an extra quicktatch collar, snap pin or small bolt, short chunk of light chain, and another bolt with two nuts. Here are some pictures to show you the probe puller we “MacGyvered” with stuff laying around the shop (sorry no duct tape or chewing gum involved). I am sure several of you may have come up with even simpler/better designs for this life-saving device. We would love to see other designs to share with customers who need to create a device that will save the day for poor samplers who find themselves in this situation!
Zone Soil Sampling and Variable Rate Fertilization: Optimizing profits
in Nitrogen, Precision Ag, Wheat/by Jodi BoeThis article originally appeared in the AGVISE Laboratories Winter 2022 Newsletter
Farmers, like all business owners, are profit maximizers: things are good when revenue exceeds cost. Things are even better when the difference between revenue and costs is substantial. The math behind increasing profit is simple: reduce costs, increase revenue. But, the difficult part is finding and implementing strategies on the farm to do this. Why not start with fertilizer, which is typically the largest annual input cost on the farm?
Your fields are variable. You know the hilltops have lower crop yields than the mid-slopes, and you know exactly how far the saline spots creep into the more productive part of the field. So why use the same rate of fertilizer in the unproductive areas as you would in the productive areas? Optimize your fertilizer inputs by reducing rates in low-yielding areas and reallocate those fertilizer dollars to the productive ground.
Figure 1. North Field zone map, created using ADMS from GK Technology.
How does one actually do this? Creating zone maps for your fields, soil sampling and testing based on productivity zones, and variable rate (VRT) fertilizer application is the place to start. Applying VRT fertilizer allows you to apply fertilizer where it is needed and not waste fertilizer dollars where it is not. Let me show you an example from my family’s farm in western North Dakota.
I farm with my dad and brother in southwest North Dakota. This past fall, I created zone maps for each of our fields, with help from GK Technology and their ADMS program. The final maps are based on historical satellite imagery. I will show you one of our fields, the North Field, and take a deep dive on nitrogen fertilizer optimization using zone soil sampling and VRT fertilization in the dryland “out west” country.
The North Field (Figure 1) is variable. That is expected on a 120-acre field with many hills and ravines (Table 1). For discussion, we will use residual soil nitrate-nitrogen results and make a nitrogen fertilizer plan using urea for hard red spring wheat (HRSW) in 2022. You can see the soil nitrogen data, crop yield goals, and final nitrogen rates in Table 2.
The first place to optimize fertilizer inputs is setting realistic crop yield goals for each zone. Spring wheat yield goals range from 65 bushel/ acre in the best zone (zone 1) to 30 bushel/acre on the hilltops (zone 5). Adjusting the nitrogen rate for the proper crop yield goal ensures that the high-producing zones are not limited by lack of nitrogen (increased fertilizer cost, increased revenue) and the low-producing zones are not overfertilized (decreased fertilizer cost, same revenue). With a responsible crop yield goal on the low-producing zones, the crop still receives the amount of nitrogen it requires, and excess nitrogen is not lost to nitrate leaching (wasted input cost). As a result, the excess nitrogen fertilizer is reallocated to high-producing zones, resulting in more crop yield with the same total fertilizer budget, and increased revenue.
The nitrogen fertilizer scenarios in Tables 3 and 4 break down the projected revenues and expenses, demonstrating the benefits of zone soil sampling and VRT fertilization. For the North Field on my farm, the projected profit increase was $3,725 for the field or $31.05 per acre. It is tough to argue with a dollar amount like that! Prices will vary, of course, for fertilizer and precision ag services in your geography. Do the math for yourself and see how zone soil sampling and VRT fertilization can maximize profits for you.
2021 Drought: High residual soil nitrate-nitrogen across the region
in Corn, Drought, Nitrogen, Regional Data, Wheat/by John LeeThis article originally appeared in the AGVISE Laboratories Winter 2022 Newsletter
The 2021 drought rivals the 1988 drought, and it covered much of the northern Great Plains and Canadian Prairies. From previous experience with droughts, we expected that residual soil nitrate-N following crops would be higher than normal, caused by the drought and reduced crop yields. The first wheat fields that were soil tested in August and September confirmed our expectation that residual soil nitrate-N was already trending much higher than normal.
The 2021 AGVISE soil test summary data highlights how exceptional the 2021 drought was. The median amount of soil nitrate-N across the region was markedly higher following wheat and corn. Over 20% of wheat fields had more than 100 lb/acre nitrate-N (0-24 inch) remaining, and another 40% of wheat fields had a sizable 40 to 80 lb/acre nitrate-N (0-24 inch) left over. For any given farm, the great variability in residual soil nitrate-N makes choosing one single nitrogen fertilizer rates impossible, and soil testing is the only way to decide that right rate for each field.
Through zone soil sampling, we were also able to identify that residual soil nitrate-N varied considerably within a field. This makes sense because we know that some areas of the field produced a fair yield, leaving behind less soil nitrate, while other areas produced very poorly and left behind much more soil nitrate. These differences across the landscape are driven by soil texture, soil organic matter, and stored soil water as well as specific problems like soil salinity or low soil pH (aluminum toxicity). Although the regional residual soil nitrate-N trends were higher overall, it is truly through zone soil sampling that we can begin to make sense of the field variability that drives crop productivity and the right fertilizer rate for next year.
For fields that have not been soil tested yet, there is still time to collect soil samples in winter (see winter soil sampling article). Nobody wants to experience another drought, but this kind of weather reminds us how important soil nitrate testing is every year for producers in the Great Plains. Each year, AGVISE summarizes soil test data for soil nutrients and properties in our major trade region of the United States and Canada. For more soil test summary data and other crops, please take a look at our soil test summaries online.
Banding Phosphorus and Potassium: Stretch your fertilizer dollars further
in Fertilizer Placement, Phosphorus, Potassium/by John BrekerThis article originally appeared in the AGVISE Laboratories Winter 2022 Newsletter
Broadcast or band? For phosphorus and potassium, these are big fertilizer questions. In recent months, high fertilizer prices have prompted farmers and agronomists to consider other strategies to reduce fertilizer costs without jeopardizing crop yield. Among the most common and effective options is placing fertilizer in a tight band below the soil surface, also known as a subsurface band.
Subsurface banding helps improve fertilizer recovery and efficiency. It ensures that fertilizer is placed in the plant root zone, facilitating direct uptake of crop nutrients. It also minimizes potential fixation reactions (aka tie-up) that reduce soil nutrient availability, allowing more phosphorus or potassium to remain available in soil for plant uptake. You ultimately get more bang for your buck on each pound of fertilizer applied. In addition, placing fertilizer below the soil surface protects fertilizer from
Idealized crop response to phosphorus as affected by fertilizer placement and soil test level (figure from J. Prod. Agric. 1:70-79).
soil erosion and runoff losses via wind and water. This is important for fall-applied phosphorus and potassium because spring snowmelt runoff and wind erosion can move fertilizer lying on the soil surface from neighbor to neighbor and watersheds beyond.
When we discuss banding phosphorus and potassium, it also comes along with the question, “How far can I cut fertilizer rates?” It is important to recognize that the improved efficiency of banding over broadcast is a function of soil test levels (figure) and proximity to the seed row. If you have high soil test levels (>15 ppm Olsen P), then the expected crop yield response to fertilizer, whether broadcast or banded, is lower. Banding fertilizer still helps with the fertilizer recovery, but the expected crop yield increase is often similar to broadcast. However, if you have low soil test levels, then the expected crop yield response is much greater with banding.
Where does seed row proximity fit in? The greatest efficiency comes with in-furrow or near-seed placement (e.g. 2×2 band), allowing effective fertilizer rates of one-half to two-thirds their broadcast equivalent. The near-seed placement also provides the starter effect, which enhances early plant growth and development in cool, wet soils of the upper Midwest and northern Great Plains. Of course, you must watch seed safety with any seed-placed fertilizer in the furrow.
For deep-band or mid-row band placement, the benefits over broadcast begin to disappear. These are still great placement options for anhydrous ammonia or urea, but the greater distance between the seed row and fertilizer band does not provide the same efficiency for immobile soil nutrients like phosphorus and potassium. This will surprise some people hoping that strip-till with deep-banded phosphorus and potassium or a one-pass air seeder with mid-row banders might be their answer to reducing fertilizer costs. For these “far-from-seed” banding options, reduced fertilizer rates are not suggested, and some in-furrow or near-seed banded fertilizer should still be applied for the current crop.
Controlling Soybean Cyst Nematode: Do you have a resistance problem?
in Disease, Regional Data, Research, Soybean/by Brent JaenischThis article originally appeared in the AGVISE Laboratories Winter 2022 Newsletter
This is the third year of our soybean cyst nematode (SCN) resistance project. Each year, we have flagged spots in soybean fields and collected paired SCN soil samples in June and September. If the SCN egg count increases through summer and into fall, we can quickly learn if the soybean SCN-resistance source, either PI88788 or Peking, is working or failing. University SCN surveys have found that the PI88788 resistance source has begun to lose its effectiveness at controlling SCN populations in much of Minnesota. This is a particular problem because 95% of SCN-resistant soybean varieties still use the PI88788 resistance source.
In 2021, paired soybean variety comparisons with SCN soil samples and soybean yield data really helped us see the difference in these SCN resistance sources. Among the sites, the Peking resistance source always had a lower SCN egg count than the PI88788 comparison, indicating that the Peking soybean varieties had better control of the SCN population at 4 of 5 sites. The Alberta site had similar SCN population control with both PI88788 and Peking resistance sources, so the soybean yield was similar at the site. However, the other sites demonstrated SCN resistance to PI88788, and the resulting soybean yield with the Peking resistance source was better with 7-bu/acre soybean yield increase on average.
For 4 of 5 sites, it is apparent that a Peking-traited soybean variety is the better choice. To learn if you have SCN resistance problems in your field, the simple early-late SCN soil sampling exercise, like we did in this project, is a quick way to learn if your current soybean variety is still controlling SCN and delivering the best soybean yield.