This article originally appeared in the AGVISE Laboratories Winter 2024 Newsletter.
A number of new handheld sensors have hit the market, claiming to accurately and precisely measure soil nutrient content in the field, similar to traditional wet chemistry analysis at a soil testing laboratory. The draw for any person soil sampling is the ability to receive soil analysis results right in the field in real time. We know that our clients have a lot of questions about these types of sensors because we are getting these questions too. For almost 50 years, AGVISE has been an early adopter and innovator of new technologies in soil and plant analysis, and these new soil sensors are among the newest to gain popular attention in agriculture.
First, handheld sensors in general are nothing new for soil analysis. There are a number of handheld pH and electrical conductivity (EC) sensors available on the market that are often used for assessing and mapping environmental sites for reclamation and remediation projects. The environmental consultants still need to collect field soil samples and send them to the laboratory for calibration and validation in their official reports. The handheld sensors are used to help them assess the site size and variability.
Second, the type of sensor for the intended soil nutrient or property for measurement is important. After all, you should not try to measure something that the sensor cannot detect, right? The new handheld soil nutrient sensors often rely on near-infrared (NIR), mid-infrared (MIR), or X-ray fluorescence (XRF) spectroscopy methods. These technologies have long existed as benchtop instruments in analytical laboratories for various applications, and each method has its strengths and limitations.
For example, NIR spectroscopy is widely used in feed and forage analysis, food processing, and even meat science. The American Society of Agronomy compiled an 800-page book on NIR applications in agriculture (https://doi.org/10.2134/agronmonogr44.c10). There is one chapter on soil analysis at the end of the book. The strengths of NIR for soil analysis include soil organic matter, total carbon, organic carbon, organic nitrogen, and even pH. However, it does not perform well for nitrate-N, P, K, sulfate-S, Ca, Mg, Na, Cu, Fe, Mn, Zn, or soluble salts (EC). Simply put, NIR fails at measuring the actual soil nutrients we are trying to manage! This is why we do not use benchtop NIR for any soil analyses at AGVISE, let alone a handheld unit with less accuracy or precision. You might see handheld NIR sensors being used for some things, but you will not see them replace soil sampling or soil nutrient analysis soon.
Third, the handheld sensor outputs are often correlated and converted, in the end, to traditional wet chemistry analysis methods, like Bray P, Olsen P, or ammonium acetate K. These are the plant-available soil test methods that we are all familiar with and have decades of soil test calibration research behind them, which allow us to make fertilizer guideline calculations from the soil test result. Whenever a correlation and conversion step takes place, this introduces error for any subsequent calculations, like fertilizer rates. It is important to know what is actually being measured versus what is being reported.
As new sensors hit the market, a person thinking about trying them should be asking a lot of questions. AGVISE is always evaluating new analysis technologies, which can help us do a better or faster job while providing high-quality data to our clients. The questions outlined above are those that we use when we evaluate new analysis technologies for our own operation, and we hope the same questions can help guide you through the gamut of new soil sensors too.

AGVISE Demonstration Project: Lowering Soil pH with Elemental Sulfur
in Research, Soil Amendment, Soil pH, Sulfur/by John BrekerThis article originally appeared in the AGVISE Laboratories Spring 2025 Newsletter.
There may not be silly questions, but there are silly answers. Every so often, we get questions about unusual solutions to manage calcareous soils in the northern Great Plains and Canadian Prairies. The most frequent oddball “solutions” involve lowering soil pH with elemental sulfur on calcareous soils. Such suggestions might work on acidic soils; however, the dominant calcareous soils in the region have high pH (>7.3) and tons of natural calcium carbonate that make such attempts impractical and expensive. To put the nail in the coffin, AGVISE Laboratories started some long-term demonstration projects to show plainly why such ideas do not work or may cost way too much!
If possible, we’d like an easy and cheap solution to lower soil pH, like applying only 100 to 200 lb/acre elemental sulfur (S). In soil, elemental S oxidizes to sulfuric acid, which can lower soil pH. However, the large amount of calcium carbonate (free lime) keeps our soils buffered at high pH. To lower soil pH permanently, you must first react and neutralize the carbonate with elemental S before the soil pH can budge. With 100 lb/acre elemental S applied each year, that does not sound too difficult, right?
Elemental sulfur project with rates ranging from 0 to 40,000 lb/acre elemental sulfur. Can you identify the 20 ton/acre rate?
Not so fast. A soil with only 1% calcium carbonate equivalent (CCE) takes 3.2 ton/acre elemental S (6,400 lb/acre) to neutralize the carbonate alone in the 0-6 inch soil depth. In 2020, we started an elemental S project at Northwood, ND on soil containing 4.5% CCE, which would require literal tons of elemental S to lower soil pH. A previous project started in 2005 had used 10,000 lb/acre elemental S, but it was not enough to lower soil pH beyond pH 7.8 after 15 years. This time, we decided to get serious and use elemental S rates from 0 to 40,000 lb/acre (Figure 1). The elemental S rates were intended to hit above and below the target 30,000 lb/acre elemental S rate required to react and neutralize 4.5% CCE.
For the first three years of the project, we saw little to no change in soil pH, regardless of elemental S rate. The oxidation process that converts elemental S to sulfuric acid is a slow, biological process that can take a long time. In Fall 2024, we finally saw real changes in soil pH following elemental S application. The 16,000 lb/acre elemental sulfur rate reached pH 7.5. The 24,000 lb/acre elemental sulfur rate reached pH 7.0. The 40,000 lb/acre elemental sulfur rate reached pH 6.0, a dramatic change! The lowest 8,000 lb/acre elemental sulfur rate, however, was no different than the control.
Start Strong, Finish Strong with Starter Phosphorus
in Corn, Phosphorus, Starter Fertilizer/by Brent JaenischThis article originally appeared in the AGVISE Laboratories Spring 2025 Newsletter.
Cool and wet soil conditions can limit root growth and phosphorus uptake during the early growing growing season. This is why starter phosphorus placed with or near the seed can be so effective in enhancing early plant growth and development. In small grains, starter phosphorus helps improve tiller initiation, even on soil with high soil test P. Faster development in spring can also help flowering wheat or canola beat the summer heat, or advance the corn silking date and maturity to help save grain drying expenses in fall.
Starter phosphorus increased early corn plant biomass (growth stage V5) when applied as 10-34-0 with seed, with and without broadcast phosphorus fertilizer. Summarized across multiple soils with pH ranges including 6.0 to 8.5. Reference: Kaiser, D.E, and J.A. Lamb. 2023. Banding fertilizer with corn seed. UMN Ext. Circ., Univ. Minnesota, St. Paul, MN. https://extension.umn.edu/crop-specific-needs/banding-fertilizer-corn-seed
Soil Sensors: Helpful Gadgets or Hapless Gimmicks?
in Equipment, Soil Chemical Analysis/by John BrekerThis article originally appeared in the AGVISE Laboratories Winter 2024 Newsletter.
A number of new handheld sensors have hit the market, claiming to accurately and precisely measure soil nutrient content in the field, similar to traditional wet chemistry analysis at a soil testing laboratory. The draw for any person soil sampling is the ability to receive soil analysis results right in the field in real time. We know that our clients have a lot of questions about these types of sensors because we are getting these questions too. For almost 50 years, AGVISE has been an early adopter and innovator of new technologies in soil and plant analysis, and these new soil sensors are among the newest to gain popular attention in agriculture.
First, handheld sensors in general are nothing new for soil analysis. There are a number of handheld pH and electrical conductivity (EC) sensors available on the market that are often used for assessing and mapping environmental sites for reclamation and remediation projects. The environmental consultants still need to collect field soil samples and send them to the laboratory for calibration and validation in their official reports. The handheld sensors are used to help them assess the site size and variability.
Second, the type of sensor for the intended soil nutrient or property for measurement is important. After all, you should not try to measure something that the sensor cannot detect, right? The new handheld soil nutrient sensors often rely on near-infrared (NIR), mid-infrared (MIR), or X-ray fluorescence (XRF) spectroscopy methods. These technologies have long existed as benchtop instruments in analytical laboratories for various applications, and each method has its strengths and limitations.
For example, NIR spectroscopy is widely used in feed and forage analysis, food processing, and even meat science. The American Society of Agronomy compiled an 800-page book on NIR applications in agriculture (https://doi.org/10.2134/agronmonogr44.c10). There is one chapter on soil analysis at the end of the book. The strengths of NIR for soil analysis include soil organic matter, total carbon, organic carbon, organic nitrogen, and even pH. However, it does not perform well for nitrate-N, P, K, sulfate-S, Ca, Mg, Na, Cu, Fe, Mn, Zn, or soluble salts (EC). Simply put, NIR fails at measuring the actual soil nutrients we are trying to manage! This is why we do not use benchtop NIR for any soil analyses at AGVISE, let alone a handheld unit with less accuracy or precision. You might see handheld NIR sensors being used for some things, but you will not see them replace soil sampling or soil nutrient analysis soon.
Third, the handheld sensor outputs are often correlated and converted, in the end, to traditional wet chemistry analysis methods, like Bray P, Olsen P, or ammonium acetate K. These are the plant-available soil test methods that we are all familiar with and have decades of soil test calibration research behind them, which allow us to make fertilizer guideline calculations from the soil test result. Whenever a correlation and conversion step takes place, this introduces error for any subsequent calculations, like fertilizer rates. It is important to know what is actually being measured versus what is being reported.
As new sensors hit the market, a person thinking about trying them should be asking a lot of questions. AGVISE is always evaluating new analysis technologies, which can help us do a better or faster job while providing high-quality data to our clients. The questions outlined above are those that we use when we evaluate new analysis technologies for our own operation, and we hope the same questions can help guide you through the gamut of new soil sensors too.
Sticky Wet Soils? Try Adding a WD-40 Holster
in Equipment/by John BrekerThis article originally appeared in the AGVISE Laboratories Fall 2024 Newsletter.
Do you have challenges collecting good quality soil cores in sticky wet soils? You are not the only one! WD-40 has been the soil probe lubricant of choice for over 30 years to help obtain better quality soil samples. University researchers have also tested WD-40 and found it does not contaminate soil samples.
Spraying WD-40 on your soil probes with the spray cans can get messy inside the pickup cab. A smart idea to make the WD-40 application process simpler and cleaner is making a WD-40 holster with some PVC pipe. The PVC pipe holster lubricates the soil probe with WD-40 between each soil core and also keeps the soil probe within easy reach. The clever idea came from a client who had spent too much time fiddling with WD-40 spray cans and losing them underneath the pickup seat.
The WD-40 holster is made from 2-inch diameter PVC pipe with a cap glued on the bottom and a threaded fitting on the top with a screw-in plug for storage when not in use. The PVC pipe should be fastened so that the open end faces the soil sampler and the soil probe can be easily placed into the pipe. Fill the PVC pipe with about 3-4 inches of WD-40 in the bottom. With the PVC pipe opening near the hole in the pickup floor, any excess WD-40 drops coming off the soil probe will go down the hole and reduce the mess of spraying WD-40 in the pickup cab.
Soybean Cyst Nematode (SCN) Egg Numbers Continue to Increase
in Disease, Regional Data, Soybean/by Brent JaenischThis article originally appeared in the AGVISE Laboratories Spring 2024 Newsletter.
Over the winter months, we received a lot of questions about the increasing soybean cyst nematode (SCN) egg count trends across the region. Soybean cyst nematode is the most damaging soybean pest in the United States, and the problem is becoming worse. The AGVISE SCN summary over the past five years (2019-2023) shows that SCN egg counts are increasing steadily in Minnesota and North Dakota, which is a serious concern for SCN management into the future.
In Minnesota, 65% of SCN soil samples in 2023 had more than 2,000 eggs per 100 cm3 soil. This is the threshold where an SCN-resistant soybean variety is suggested, yet some soybean yield loss is still expected. The percentage of soil samples with zero or low egg counts (<200 eggs) has declined from 17% in 2019 to 8% in 2023, meaning that there are fewer SCN-free fields in the state. More alarming,
the percentage of soil samples with more than 10,000 eggs has skyrocketed from 3% in 2019 to 20% in 2023. This is the threshold above which planting soybean is not suggested, whether resistant or tolerant to SCN, and a non-host rotation crop is suggested.
In North Dakota, 48% of SCN soil samples in 2023 had more than 2,000 eggs per 100 cm3 soil. The percentage of soil samples with zero or low egg counts (<200 eggs) has declined from 43% in 2019 to 20% in 2023. More alarming, the percentage of soil samples with more than 10,000 eggs has quickly increased from 4% in 2019 to 12% in 2023.
These SCN summary trends highlight a growing concern for soybean growers. With SCN, an ounce of prevention is worth more than a pound of cure. A consistent SCN soil sampling program remains one of the best tools to monitor SCN populations. This is how we learn if current SCN management strategies like crop rotation and SCN-resistant varieties are working, or if you need to reevaluate your soybean management plan. A detailed guide to collecting SCN soil samples can be found at the SCN Coalition website.
Zone Soil Sampling: How Many Zones?
in Precision Ag, Regional Data/by John BrekerZone soil sampling has become a standard practice in precision nutrient management, but the grand question remains – How many zones should you be soil sampling?
Well, it depends! It just makes sense that a field with more variability requires more zones than a field with little variability. Zone soil sampling separates parts of fields that behave differently into similar zones that can be managed together. Common data layers used to build zone soil sampling maps include satellite imagery, plant vegetation indices, crop yield, salinity, topography, and even bare soil color.
As a soil testing laboratory, AGVISE does not know what data layers are used to create the zone maps, but we do know the soil nutrient levels in each zone. Clients often ask how many zone soil samples should be collected in each field to get the best soil nutrient information. Common sense tells us that splitting fields into more zones should provide more detailed soil nutrient data.
With soil test data from thousands of zone soil sampled fields, we mined the AGVISE database to see what the average range in soil test levels per field (high testing zone minus low testing zone) could tell us about field variability and the number of zones that should be sampled. The table summarizes the average range in soil test levels for over 24,000 zone soil sampled fields in 2023. The number of zones ranges from 3 to 8 zones per field. You can see, as the number of zones increases, the difference between the high zone and low zone gets larger and larger.
This data reminds us that more zones per field can tell us more about the soil nutrient status in each field, providing more powerful information to develop variable-rate fertilizer applications. If you have variable landscapes with rolling topography, diverse soil types, or salinity problems, you may have to take more zone soil samples per field (5-7 zones) to see the greatest differences in soil fertility and to take full advantage of variable-rate fertilizer applications. If your landscapes have less variability with fewer soil types, relatively flat topography, and no salinity problems, then you can probably take fewer zone samples per field (3-4 zones).
Winter Soil Sampling: You Need the Right Tools
in Equipment/by John BrekerSnowfall in late October and November slowed harvest and soil sampling across the region. This means some fields will be soil sampled in December and maybe January as harvest for late-season crops continues in the snow.
The right equipment is the key to any project, and winter soil sampling is no different. AGVISE heavy-duty (HD) chromoly soil probes were designed for hard, frozen soil conditions. Chromoly steel is much tougher than stainless steel, and it handles the stress of sampling frozen soil. To punch through several inches of frost, you will also require additional weight. Most soil sampling trucks have the hydraulic cylinder mounted inside the truck cab, where you can take advantage of the entire truck weight to push through the frost. This enables you to take soil samples through 4 to 6 inches of frost on most medium- and fine-textured soils in winter. For receiver hitch-mounted hydraulic cylinders, you will need to add extra weight in the truck box, and it may limit you to pushing through only 1 to 3 inches of frost.
AGVISE offers wet and dry soil probe tips for the HD chromoly soil probe. The wet soil probe tip is best suited for frozen soils. The HD chromoly soil probe is available with or without a slot.
You can view examples of in-cab and receiver hitch-mounted hydraulic soil sampling systems on our website (https://www.agvise.com/installed-soil-sampling-kit-examples/). You can also find videos of soil sampling in frozen soils with the HD chromoly soil probe and wet soil probe tip.
Lime Works: The Results Are In
in Research, Soil Amendment, Soil pH/by Jodi BoeThis article was originally published in the AGVISE Laboratories Winter 2023 Newsletter.
In the fall of 2022, I hired a custom applicator to haul and spread lime across 238 acres of my family’s farm in western North Dakota. The reason? To increase soil pH on five fields with very low soil pH. One field even had a soil pH of 4.7, so these were good candidate fields for a practical case study for liming on a real farm operation.
I wrote more about the soil sampling process and lime application in the AGVISE Winter 2022 newsletter (https://www.agvise.com/wp-content/uploads/2022/11/AGVISE-Newsletter-2022-Winter.pdf). Each field received approximately 2 ton/acre sugar beet lime (1.4 ton ENP/acre) from Sidney Sugar in Sidney, MT, and the lime was disced to 3 inches for incorporation. After one year, the soil pH had already increased by 0.36 pH-units in the 0-6 inch soil depth. The 2023 growing season was relatively wet in southwest North Dakota, and the additional soil water certainly helped the lime react and neutralize soil acidity quickly. The incorporation with a disc also helped distribute the lime more evenly and deeply, allowing the lime to react faster. One negative side effect of tillage was a flush of annual weeds, particularly green and yellow foxtail. This was the first tillage event on these fields in 12 years, so I expect the annual weed community to diminish as we return to no-till after the one-time tillage pass.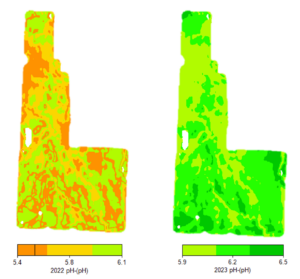
Figure 1. Zone soil pH map of a field receiving 2 ton/acre sugar beet lime in fall 2022. Each zone increased roughly 0.36 pH-units from 2022 to 2023. (Maps created in ADMS 32, GK Technology, Inc.)
Lime also works without incorporation, just at a slower pace. In 2021, we established a no-till lime trial to investigate lime rates without incorporation. Lime was applied in May 2021, and the fall 2023 soil pH results are shown in Figure 2. The highest lime rate at 2.5 ton ENP/acre increased soil pH in the upper 0-3 inch soil depth by 0.71 pH-units over 2.5 years. So far, no effect on soil pH in the lower 3-6 inch soil depth has been observed. In most no-till systems, the most acidic part of the soil profile is located at the soil surface, and a lime application correcting soil pH in the upper 0-3 inch soil depth is still effective. This is where seedlings and roots are most vulnerable to soil acidity, so correcting soil pH at the soil surface is critical and can be accomplished with a surface application of lime in no-till systems.
Surface Soil pH (0-3 inch) in No-till Lime Trial, October 2023
Figure 2. Soil pH following surface application of lime after 2.5 years in a no-till cropping system in southwestern North Dakota.
Soil Nitrogen Trends – Fall 2023: Some Up, Some Down
in Drought, Nitrogen, Regional Data, Wheat/by John BrekerThe 2023 drought was an all-too-soon reminder of the widespread 2021 drought. It covered much of the upper Midwest, Great Plains, and Canadian Prairies. From previous experience with droughts, we expected that residual soil nitrate-N following crops would be higher than normal, caused by the drought and reduced crop yields. The first wheat fields that were soil tested in August and September confirmed our expectation that residual soil nitrate-N was already trending higher than normal. Yet, some regions were spared the drought and received above-average rainfall, and achieved record-setting crop yields. For these regions, the amount of residual soil nitrate-N after high-yielding crops was near or below average.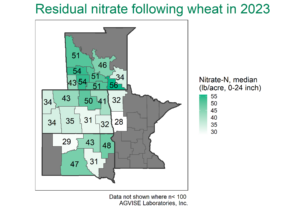
The 2023 AGVISE soil test summary data highlights the great variability following the drought. The median amount of soil nitrate-nitrogen across the region was higher than the long-term average following wheat. Over 28% of wheat fields had more than 60 lb/acre nitrate-N (0-24 inch) remaining. Yet, another 17% of wheat fields had less than 20 lb/acre nitrate-N remaining, suggesting either lost crop yield or protein due to insufficient nitrogen nutrition. For any given farm, the great variability in residual soil nitrate-N across all acres makes choosing one single nitrogen fertilizer rate impossible for next year, and soil testing is the only way to decide that right rate for each field.
Through zone soil sampling, we are also able to identify that residual soil nitrate-nitrogen can vary considerably within the same field. This makes sense because we know that some areas of the field produced a fair or good yield, leaving behind less soil nitrate, while other areas produced very poorly and left behind much more soil nitrate. These differences across the landscape are driven by soil texture, soil organic matter, and stored soil water as well as specific problems like soil salinity or low soil pH (aluminum toxicity). Although the regional residual soil nitrate-nitrogen trends were higher overall, it is truly through zone soil sampling that we can begin to make sense of the field variability that drives crop productivity and determine the right fertilizer rate for next year.
For fields that have not been soil tested yet, there is still time to collect soil samples in winter. Nobody wants to experience another drought, but this kind of weather reminds us how important soil nitrate testing is every year for producers in the Great Plains and Canadian Prairies. Each year, AGVISE summarizes soil test data for soil nutrients and properties in our major trade regions of the United States and Canada. For more soil test summary data and other crops, please view our soil test summaries online: https://www.agvise.com/resources/soil-test-summaries/
Choosing the Right Phosphorus Method
in Phosphorus, Soil Chemical Analysis/by Cindy EvensonThis article originally appeared in the AGVISE Laboratories Spring 2023 Newsletter under President’s Corner
The phosphorus soil test debate never ends. Should I use the Olsen test, or maybe Bray-1 would be better? What about the Mehlich-3 method, and should that extract be analyzed on an ICP or with a colorimetric method? Perhaps, Bray-2 or the Haney extractable P is something to consider? This whole phosphorus test dilemma can be quite confusing; however, the answer is quite simple. Use the soil phosphorus test that is calibrated for your region!
In the upper Midwest, the Olsen test is the most reliable method to determine phosphorus availability and has the most correlation and calibration data with field trials. Many hours have been spent by university researchers putting out field trials to determine phosphorus fertilizer rates for various crops. The researchers have evaluated various phosphorus methods, and the two most common methods are the Bray-1 and Olsen extractants. The Bray-1 method is the older method, developed in Illinois. It works well on soils with pH below 7.3. Once the soil pH is above 7.3, the extractant may fail. If the test fails, it will produce a result near zero.
The Olsen method is required on calcareous soils (pH > 7.3), but it also works well on acidic soils. There is a common misconception that the Olsen method is only suitable on calcareous soils. In fact, the Olsen method is widely used across the world because of its versatility on acidic and calcareous soils. It is a perfect fit for our region because it works so well across a wide soil pH range and on diverse soil types. In the AGVISE Newsletter Spring 2017 issue, retired AGVISE President Robert Deutsch compiled soil test data for the Bray-1 and Olsen methods with over 25,000 soil samples. The graphs highlight how robust the Olsen phosphorus method is, working on acidic and calcareous soils alike.
The Mehlich-3 method has gained popularity in the southeast United States and the central Midwest. In these regions, the soils are more weathered and often do not have problems with high calcium carbonate content. At the University of Minnesota, Dr. Dan Kaiser has worked on Mehlich-3 method correlation on Minnesota soils for quite a few years. For some soils, the Mehlich-3 method performed as expected, while some others had Mehlich-3 results 8 to 10 times higher than expected. For these reasons, the Mehlich-3 method has not been approved for use in the upper Midwest or northern Great Plains.
As of this time the only phosphorus soil tests recommended for soils in the upper Midwest are the Olsen and Bray-1 extracts. If someone mentions using any other phosphorus soil test, it has not been tested or correlated to the soils in this region.