Phosphorus and the 4Rs: The progress we have made
The year 2019 marked the 350th anniversary of discovering phosphorus, an element required for all life on Earth and an essential plant nutrient in crop production. Over the years, we have fallen in and out of love with phosphorus as a necessary crop input and an unwanted water pollutant. Through improved knowledge and technologies, we have made great progress in phosphorus management in crop production. Let’s take a look at our accomplishments!
Right Rate
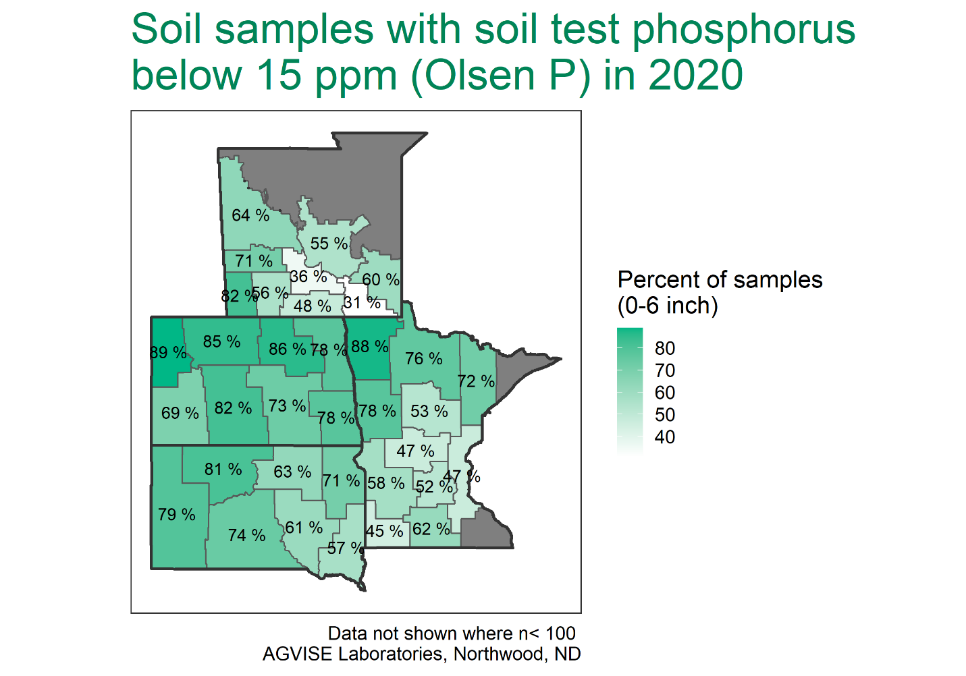
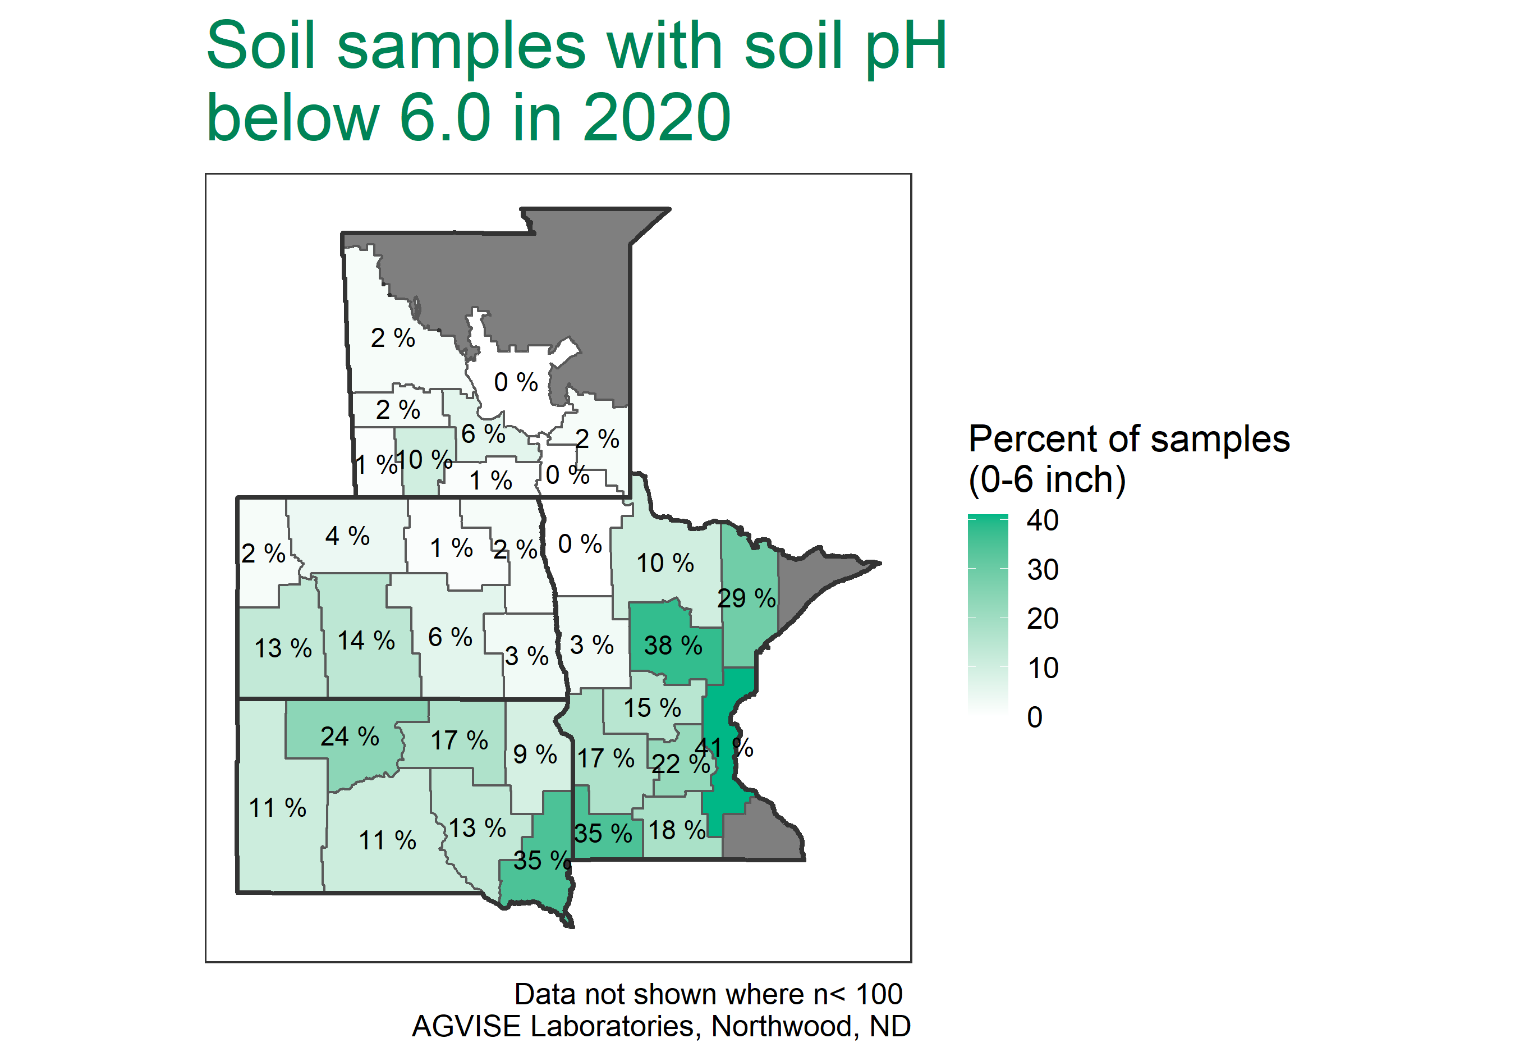
Phosphorus fertilizer need and amount is determined through soil testing, based on regionally calibrated soil test levels for each crop. Soils with low soil test phosphorus require more fertilizer to optimize crop production, whereas soils with excess soil test phosphorus may only require a starter rate. Across the upper Midwest and northern Great Plains, soil testing shows that our crops generally need MORE phosphorus to optimize crop yield (Figure 1), particularly as crop yield and crop phosphorus removal in grain has increased. Since plant-available phosphorus varies across any field, precision soil sampling (grid or zone) allows us to vary fertilizer rates to better meet crop phosphorus requirements in different parts of the field.
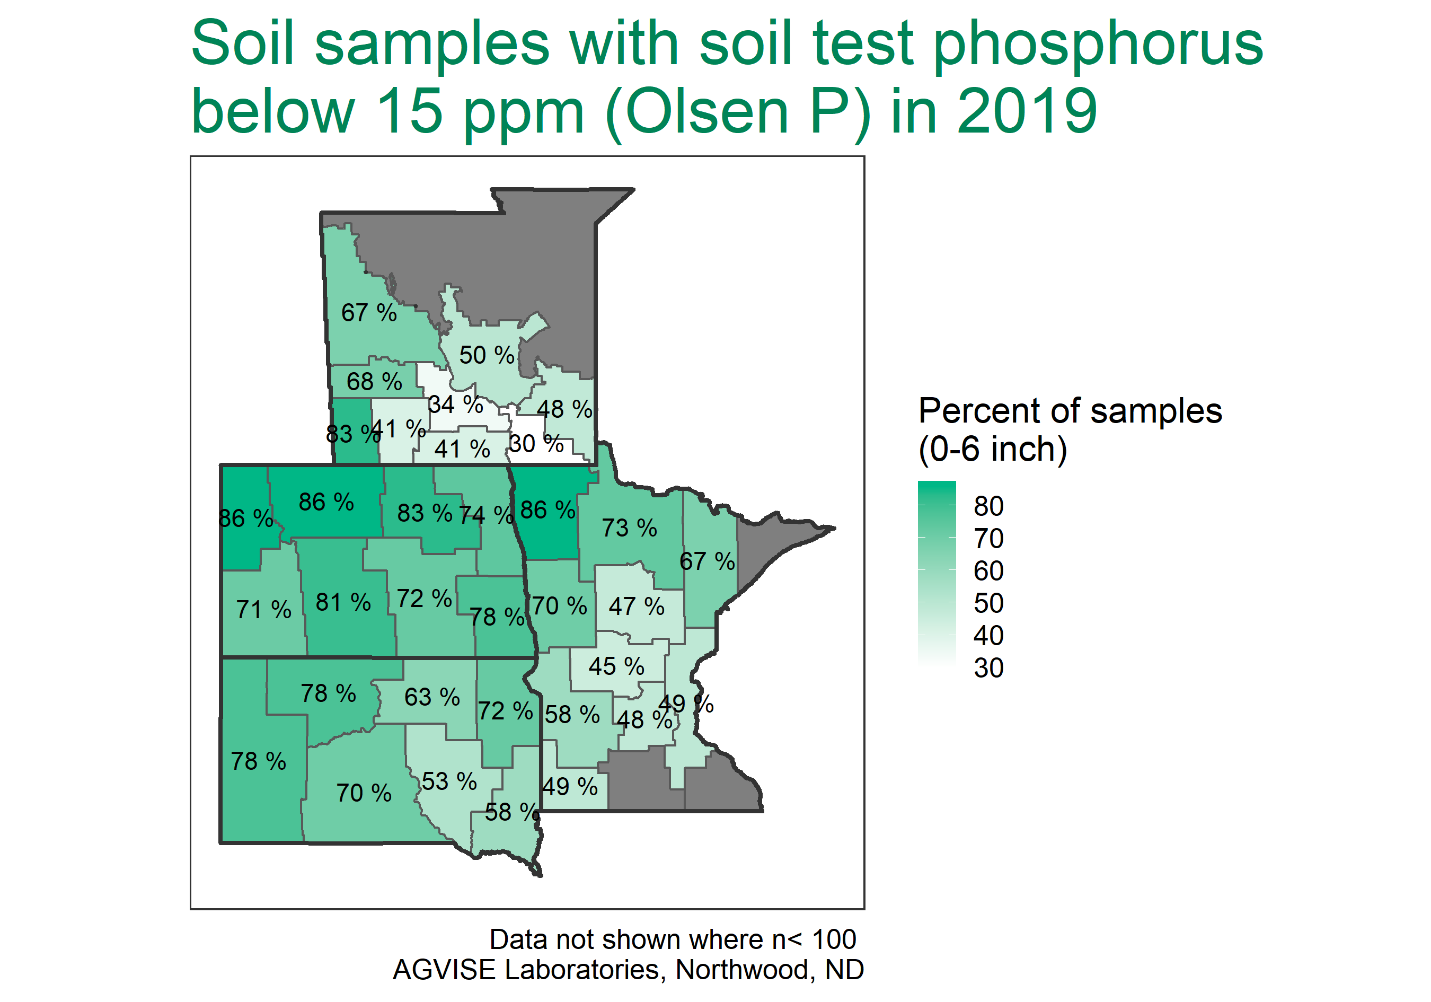
Figure 1. Soil samples with soil test phosphorus below 15 ppm critical level (Olsen P) across the upper Midwest and northern Great Plains in 2019.
Right Source
Nearly all phosphorus fertilizer materials sold in the upper Midwest and northern Great Plains are some ammoniated phosphate source, which has better plant availability in calcareous soils. Monoammonium phosphate (MAP, 11-52-0) is the most common dry source and convenient as a broadcast or seed-placed fertilizer. Some new phosphate products also include sulfur and micronutrients in the fertilizer granule, helping improve nutrient distribution and handling. The most common fluid source is ammonium polyphosphate (APP, 10-34-0), which usually contains about 75% polyphosphate and 25% orthophosphate that is available for immediate plant uptake. Liquid polyphosphate has the impressive ability to carry 2% zinc in solution, whereas pure orthophosphate can only carry 0.05% zinc. Such fertilizer product synergies help optimize phosphorus and micronutrient use efficiency.
Right Time
Soils of the northern Great Plains are often cold in spring, and early season plant phosphorus uptake can be limited to new seedlings and their small root systems. We apply phosphorus before or at planting to ensure adequate plant-available phosphorus to young plants and foster strong plant development. In-season phosphorus is rarely effective as a preventive or corrective strategy.
Right Place
Proper phosphorus placement depends on your system and goals. Broadcasting phosphorus fertilizer followed by incorporation allows quick application and uniform distribution of high phosphorus rates. This strategy works well if you are building soil test phosphorus in conventional till systems. In no-till systems, broadcast phosphorus without incorporation is not ideal because soluble phosphorus left on the surface can move with runoff to water bodies.
In no-till systems, subsurface banded phosphorus is more popular because phosphorus is placed below the soil surface, thus less vulnerable to runoff losses. In general, banded phosphorus is more efficient than broadcast phosphorus. In the concentrated fertilizer band, less soil reacts with the fertilizer granules, thus reducing phosphorus fixation, allowing improved plant phosphorus uptake. Some planting equipment configurations have the ability to place fertilizer near or with seed, which further optimizes fertilizer placement and timing for young plants.
For more information on 4R phosphorus management, please read this excellent open-access review article: Grant, C.A., and D.N. Flaten. 2019. J. Environ. Qual. 48(5):1356–1369.