Banding Phosphorus and Potassium: Stretch your fertilizer dollars further
This article originally appeared in the AGVISE Laboratories Winter 2022 Newsletter
Broadcast or band? For phosphorus and potassium, these are big fertilizer questions. In recent months, high fertilizer prices have prompted farmers and agronomists to consider other strategies to reduce fertilizer costs without jeopardizing crop yield. Among the most common and effective options is placing fertilizer in a tight band below the soil surface, also known as a subsurface band.
Subsurface banding helps improve fertilizer recovery and efficiency. It ensures that fertilizer is placed in the plant root zone, facilitating direct uptake of crop nutrients. It also minimizes potential fixation reactions (aka tie-up) that reduce soil nutrient availability, allowing more phosphorus or potassium to remain available in soil for plant uptake. You ultimately get more bang for your buck on each pound of fertilizer applied. In addition, placing fertilizer below the soil surface protects fertilizer from
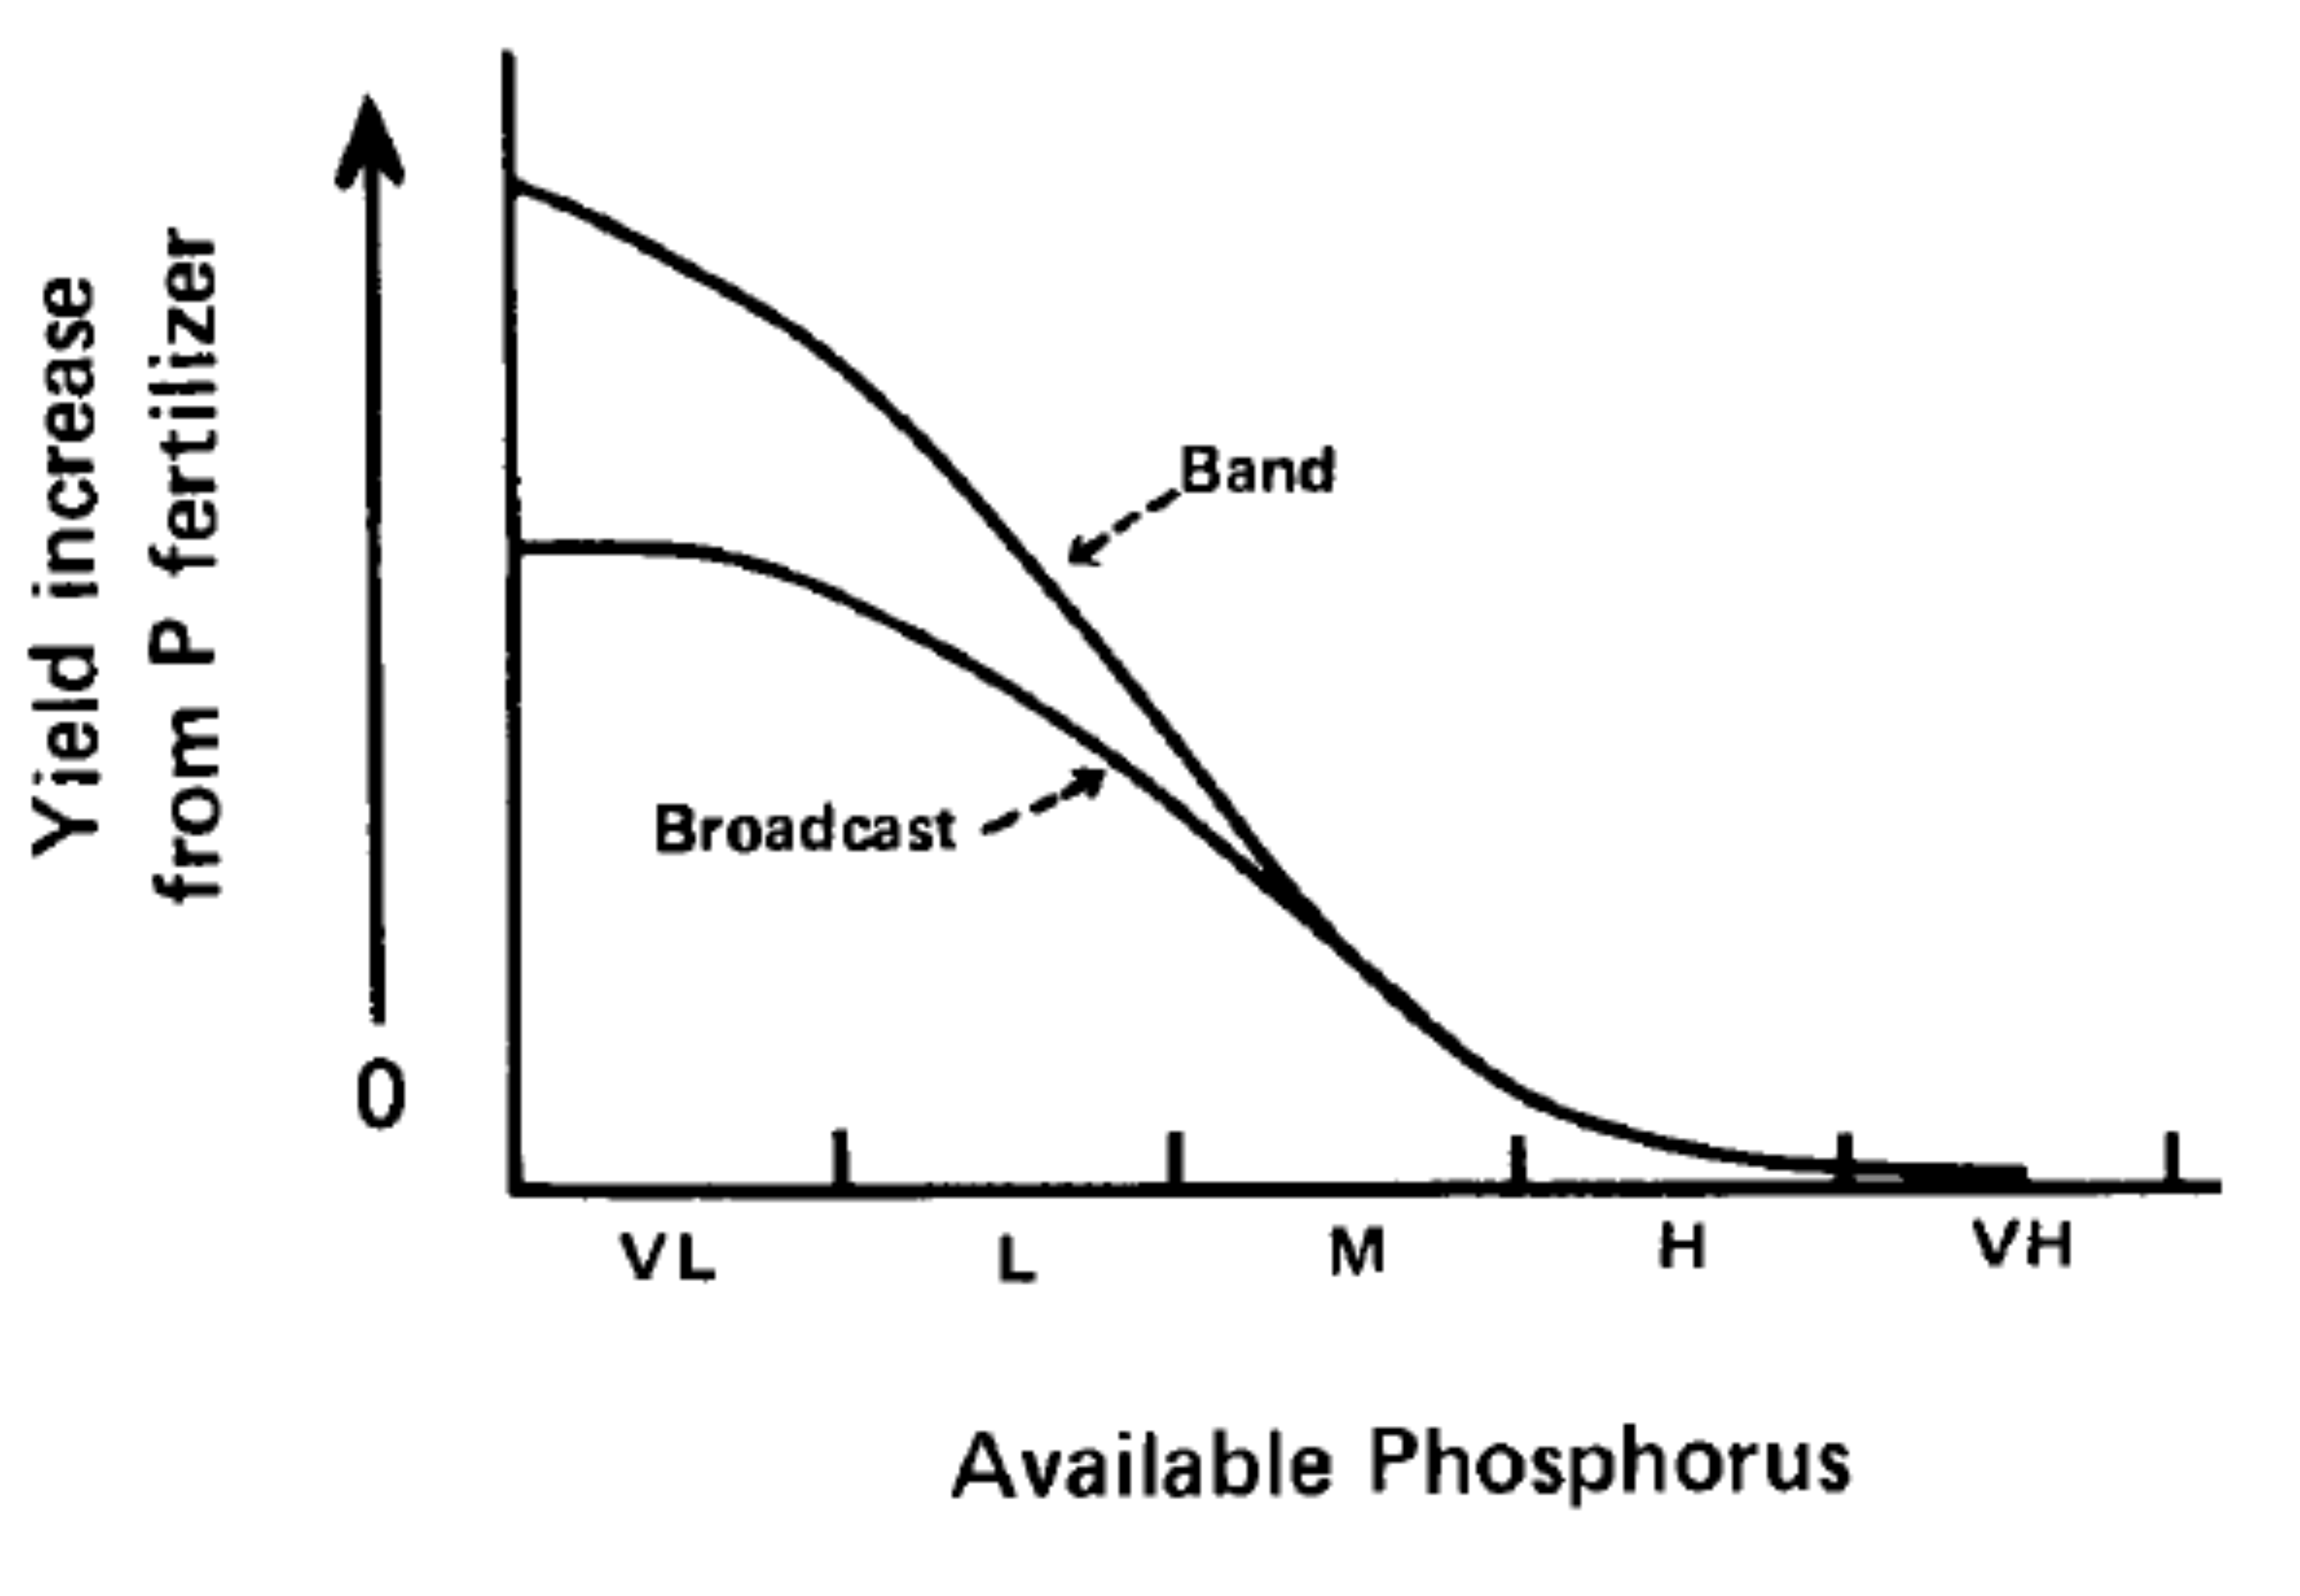
Idealized crop response to phosphorus as affected by fertilizer placement and soil test level (figure from J. Prod. Agric. 1:70-79).
soil erosion and runoff losses via wind and water. This is important for fall-applied phosphorus and potassium because spring snowmelt runoff and wind erosion can move fertilizer lying on the soil surface from neighbor to neighbor and watersheds beyond.
When we discuss banding phosphorus and potassium, it also comes along with the question, “How far can I cut fertilizer rates?” It is important to recognize that the improved efficiency of banding over broadcast is a function of soil test levels (figure) and proximity to the seed row. If you have high soil test levels (>15 ppm Olsen P), then the expected crop yield response to fertilizer, whether broadcast or banded, is lower. Banding fertilizer still helps with the fertilizer recovery, but the expected crop yield increase is often similar to broadcast. However, if you have low soil test levels, then the expected crop yield response is much greater with banding.
Where does seed row proximity fit in? The greatest efficiency comes with in-furrow or near-seed placement (e.g. 2×2 band), allowing effective fertilizer rates of one-half to two-thirds their broadcast equivalent. The near-seed placement also provides the starter effect, which enhances early plant growth and development in cool, wet soils of the upper Midwest and northern Great Plains. Of course, you must watch seed safety with any seed-placed fertilizer in the furrow.
For deep-band or mid-row band placement, the benefits over broadcast begin to disappear. These are still great placement options for anhydrous ammonia or urea, but the greater distance between the seed row and fertilizer band does not provide the same efficiency for immobile soil nutrients like phosphorus and potassium. This will surprise some people hoping that strip-till with deep-banded phosphorus and potassium or a one-pass air seeder with mid-row banders might be their answer to reducing fertilizer costs. For these “far-from-seed” banding options, reduced fertilizer rates are not suggested, and some in-furrow or near-seed banded fertilizer should still be applied for the current crop.