Adjusting low soil pH with sugar beet-processing spent lime

The sugar beet processing industry uses large quantities of fine-ground, high-grade calcium carbonate (lime) to purify sucrose in the sugar extraction process. The by-product spent lime retains high reactivity and purity, making an attractive liming material for acidic soils. Application of spent lime is a common practice through the sugar beet producing areas of the upper Midwest and northern Great Plains, where its primary function is the suppression of the soil-borne disease Aphanomyces root rot of sugar beet. The spent lime also contains about 20 lb P2O5 per ton, mostly as organic phosphorus impurities gained from sugar refining.

AGVISE Laboratories installed a long-term demonstration project in 2014 to evaluate adjusting low soil pH with spent lime. The project site was located near our Northwood Laboratory. Northwood lies along the beachline of glacial Lake Agassiz, where well-drained coarse-textured soils with low pH are common. We located a very acidic soil with soil pH 4.7 (0-6 inch), which was the perfect site to evaluate lime application. In May 2014, spent lime was applied and incorporated with rototiller. The spent lime quality was very high at 1,500 lb ENP/ton. In Minnesota, lime quality is measured as effective neutralizing power (ENP), which measures lime purity and fineness. Soil pH was tracked over three years (Table 1).

The lowest spent lime rate (2,500 lb ENP/acre) increased soil pH above 5.5. This soil pH reduced aluminum toxicity risk, but it did not reach the target pH 6.0, appropriate for corn-soybean rotation. The highest spent lime rate (10,000 lb ENP/acre) increased soil pH above 7.0 and maintained soil pH for several years. Spent lime is a fine-ground material with high reactivity, so its full effects were seen in the first application year. The project showed that spent lime is an effective liming material for low pH soils.

Table 1. Soil pH (1:1) following sugar beet-processing spent lime application on low pH soil.
Spent Lime Year
May 2014 Sept 2014 July 2015 June 2016
lb ENP/acre
0 4.8 4.8 4.7 5.1
2,500 4.8 5.5 5.2 5.4
5,000 4.8 5.6 5.7 5.5
10,000 4.8 7.4 7.0 7.4
Spent lime applied and incorporated September 2008. Soil sampled in fall.

High soil pH and calcium carbonate inflate base cation saturation and cation exchange capacity (CEC)

Soil pH is a soil chemical property that measures soil acidity or alkalinity, and it affects many soil chemical and biological activities. Soils of the northern Great Plains and Canadian Prairies often have high soil pH (>7.3) and contain calcium carbonate (free lime) at or near the soil surface. It is the calcium carbonate in soil that maintains high soil pH and keeps it buffered around pH 8.0. The calcium carbonate originates from soil formation processes since the latest glacial period.

Soils with high pH and calcium carbonate create analytical challenges in determining cation exchange capacity (CEC) and subsequent base cation saturation ratio (BCSR) calculations. Cation exchange capacity is the amount of positive-charged cations (e.g. ammonium, calcium, hydrogen, magnesium, potassium, sodium) held on negative-charged soil particles, like clay and organic matter. Fine-textured soils (high clay content) and organic soils (high organic matter content) have high CEC, while coarse-textured soils (low clay content) have low CEC. The BSCR is the relative proportion of base cations in soil.

The routine laboratory method to determine CEC is the summation method, where all extractable cations on soil particles are added together. The assumption is that all positive-charged cations extracted are held on negative-charged exchange sites on soil particles. The assumption falls apart in soils with pH > 7.3 because the soil test method also extracts calcium from the naturally occurring soil mineral calcium carbonate, which is not held on cation exchange sites. The resulting amount of extractable calcium is inflated. The summation procedure still sums together the inflated calcium result, producing an inaccurate and inflated CEC result. Any subsequent base cation saturation calculations are similarly flawed.

To illustrate the inflated CEC problem, AGVISE Laboratories conducted a laboratory experiment. The experiment showed that more calcium carbonate in soil increased the amount of extractable calcium (Table 1). Furthermore, the inflated amount of extracted calcium also inflated the CEC because all the extractable cations are summed together. The correct CEC is 24 cmolc/kg, yet the inflated CEC could be 150 to 200% higher with increasing calcium carbonate content. Adding calcium carbonate to soil did not increase the inherent CEC sources, i.e. clay and organic matter, yet the laboratory CEC result increased. In reality, the ability to hold more cations did not change. This highlights the analytical challenge in determining CEC via summation method on soils with high pH and calcium carbonate.

Table 1. Effect of calcium carbonate addition on extractable cations and cation exchange capacity.
Calcium carbonate equivalent (CCE) pH EC Ca Mg K Na CEC
% dS/m —————– ppm —————– cmolc/kg
0 7.5 0.43 3350 730 220 45 24
1 7.6 0.51 6150 730 220 50 37
5 7.7 0.52 7480 720 215 45 44
10 7.8 0.50 7240 650 180 40 42
Abbrev.: pH (1:1); EC, electrical conductivity (1:1); Ca, calcium; Mg, magnesium; K, potassium; Na, sodium; CEC, cation exchange capacity via summation of cations.

The subsequent base cation saturation calculations were also affected, showing much lower percent potassium saturation as calcium carbonate content increased (Table 2). This presents a major challenge in using the base cation saturation ratio (BCSR) concept to guide soil fertility and plant nutrition on soils with high pH and calcium carbonate. Without an accurate analytical method, the BCSR concept loses its grounding and any practical application.

Table 2. Effect of calcium carbonate addition on base cation saturation ratio and cation exchange capacity.
Calcium carbonate equivalent (CCE) Ca sat. Mg sat. K sat. Na sat. CEC
% ————————– % ————————– cmolc/kg
0 71 26 2.4 0.8 24
1 82 16 1.5 0.6 37
5 85 14 1.2 0.4 44
10 86 13 1.1 0.4 42
Abbrev.: Ca, calcium; Mg, magnesium; K, potassium; Na, sodium; CEC, cation exchange capacity via summation of cations.

In general, the routine CEC method via summation of cations is quite accurate on soils with pH less than 7.3 and no calcium carbonate. However, the routine method has clear challenges on soils with pH greater than 7.3. The resulting CEC and subsequent base cation saturation calculations are inflated and/or flawed. This is why the BCSR concept is extremely misleading on soils with high pH.

Adjusting high soil pH with elemental sulfur

Soil pH is a soil chemical property that measures soil acidity or alkalinity, and it affects many soil chemical and biological activities. Soils with high pH can reduce the availability of certain nutrients, such as phosphorus and zinc. Soils of the northern Great Plains and Canadian Prairies often have high soil pH (>7.3) and contain calcium carbonate (free lime) at or near the soil surface. It is the calcium carbonate in soil that maintains high soil pH and keeps it buffered around pH 8.0. The calcium carbonate originates from soil formation processes since the latest glacial period.

An unfounded soil management suggestion is that soil pH can be successfully reduced by applying moderate rates of elemental sulfur (about 100 to 200 lb/acre elemental S). Elemental sulfur must go through a transformation process called oxidation, converting elemental sulfur (S0) to sulfuric acid (H2SO4), a strong acid. Sulfuric acid does lower soil pH, but the problem is the amount of carbonate in the northern region, which commonly ranges from 1 to 5% CCE and sometimes over 10% CCE. Soils containing carbonate (pH >7.3) will require A LOT of elemental sulfur to neutralize carbonate before it can reduce soil pH.

To lower pH in soils containing carbonate, the naturally-occurring carbonate must first be neutralized by sulfuric acid generated from elemental sulfur. You can visualize the fizz that takes place when you pour acid on a soil with carbonate. That fizz is the acid reacting with calcium carbonate to produce carbon dioxide (CO2) gas. Once all calcium carbonate in soil has been neutralized by sulfuric acid, only then can the soil pH be lowered permanently. It is important to note that sulfate-sulfur sources, such as gypsum (calcium sulfate, CaSO4), do not create sulfuric acid when they react with soil, so they cannot neutralize calcium carbonate or change soil pH (Figure 1).

Figure 1. Soil pH following gypsum application on soil with high pH and calcium carbonate.

In 2005, AGVISE Laboratories installed a long-term demonstration project evaluating elemental sulfur and gypsum on a soil with pH 8.0 and 2.5% calcium carbonate equivalent (CCE). The highest elemental sulfur rate was 10,000 lb/acre (yes, 5 ton/acre)! We chose such a high rate because the soil would require a lot of elemental sulfur to neutralize all calcium carbonate. Good science tells us that 10,000 lb/acre elemental sulfur should decrease soil pH temporarily, but it is still not enough to lower soil pH permanently. In fact, this is exactly what we saw (Figure 2). Soil pH declined in the first year, but it returned to the initial pH over subsequent years because the amount of elemental sulfur was not enough to neutralize all calcium carbonate.

Figure 2. Soil pH following elemental sulfur application on soil with high pH and calcium carbonate.

A quick calculation showed that the soil with 2.5% CCE would require about 16,000 lb/acre elemental sulfur to neutralize all calcium carbonate in the topsoil. Such high rates of elemental sulfur are both impractical and expensive on soils in the northern Great Plains. The only thing to gained is a large bill for elemental sulfur. While high soil pH does lower availability of phosphorus and zinc, you can overcome these limitations with banded phosphorus fertilizer and chelated zinc on sensitive crops. All in all, high soil pH is manageable with the appropriate strategy. That strategy does not involve elemental sulfur.

Soil Salinity Analysis: Which method to choose?

This submission is courtesy of Dr. Heather Matthees, Research Soil Scientist, USDA-ARS, Morris, MN. It was originally published in the AGVISE Newsletter Fall 2017.

Salt-affected soils are a major problem for agricultural producers, resulting in $12 billion annual losses in crop production across the world. In the northern Great Plains and Canadian Prairies, soil salinity has always existed in some soils of the region, but the problem has become more widespread and severe since a hydrological wet period began in the 1990s.

Salinity is the overall abundance of soluble salts, which compete with plant water uptake and reduce crop productivity. The soluble salts pull soil water toward themselves in the soil solution, which leaves less soil water available for plant uptake. This causes an apparent drought stress, reducing crop productivity and sometimes may kill the plant. Soluble salts are naturally occurring and a product of regional geology in the northern Great Plains and Canadian Prairies. Since the 1990s, the hydrological wet period has raised the groundwater level and allowed saline groundwater to rise toward the soil surface, causing soil salinization. Saline soils are often called “salty,” “sour”, or “white alkali.”

The severity of soil salinity will control which plant species are suitable for crop or forage production. Some crop species like dry bean and soybean are very sensitive to salinity, whereas other crop species like barley and sunflower have good tolerance to salinity. For soils with very high salinity, the only practical forage option may be salt-tolerant perennial grasses. To assess soil salinity, there are two soil analysis methods: saturated paste extraction and routine 1:1 soil water methods.

Saturated Paste Extraction Method

The gold standard in soil salinity research is the saturated paste extraction method. The method requires a trained laboratory technician to mix soil and water into a paste, just reaching the saturation point, which is about the consistency of pudding. The saturated paste rests overnight to dissolve the soluble salts. It is then is placed under vacuum to draw the saturated paste extract. Soil salinity is then determined by measuring the electrical conductivity (EC) of the saturated paste extract.

The saturated paste extraction method is fairly straightforward, but it requires a trained technician, specialized equipment, and over 24 hours to complete the procedure. The procedure is labor intensive and difficult to automate, so it is considered a special analysis service in commercial soil testing. Therefore, it is more expensive than routine soil testing methods. Among soil salinity determination methods, it is considered the most accurate because the soil:water ratio at saturation controls for differences in soil texture and water holding capacity.

Routine 1:1 Soil:Water Method

The routine method for soil salinity assessment is the 1:1 soil:water method, which mixes standard mass of soil (10 g) and volume of water (10 mL) in a soil-water slurry. Soil salinity is then determined by measuring the electrical conductivity (EC) of the soil-water slurry. It is most commonly abbreviated EC1:1.

The method is fast and inexpensive (only 5-10% of saturated paste extraction cost). The low cost per soil sample allows a person to collect more soil samples from various soil depths and multiple locations within a field (e.g. zone soil sampling), which can create a more comprehensive and detailed soil salinity map to evaluate soil salinity presence, severity, and variability. Since soil salinity is so intimately related to soil water movement across the landscape, the soil salinity map also provides information about soil water accumulation and leaching, soil nutrient movement (e.g. chloride, nitrate-nitrogen, sulfate-sulfur), and crop productivity potential.

A general caveat about the 1:1 soil:water method is that the reported values will be lower than the saturated paste extraction method. Fortunately, the two methods are highly correlated. AGVISE Laboratories worked with soil science researchers at North Dakota State University and South Dakota State University to validate the correlation between the two methods using over 2,300 soil samples from the northern Great Plains. You can convert the two methods by multiplying the 1:1 soil:water result by 2.26 to estimate the saturated paste extraction result (Figure 1).

The simple method conversion enables you to quickly and cheaply monitor soil salinity using the 1:1 soil:water method and still utilize the historical soil salinity interpretation criteria based on the saturated paste extraction method.

Figure 1. Soil salinity method conversion between saturated paste extraction and 1:1 soil:water methods.

References

Matthees, H. L., He, Y., Owen, R. K., Hopkins, D., Deutsch, B., Lee, J., Clay, D. E., Reese, C., Malo, D. D., & DeSutter, T. M. 2017. Predicting soil electrical conductivity of the saturation extract from a 1:1 soil to water ratio. Communications in Soil Science and Plant Analysis, 48(18), 2148–2154.

Quality Control is First Priority for AGVISE

When you receive a soil test report from AGVISE you should expect the best. Since our start in 1976, our first priority has been providing you with the most accurate soil test data. Ensuring proper quality control and quality assurance (QC/QA) takes extra care and dedication from everyone at AGVISE to provide you with the best data possible.

for quality control article

Quality control in sample identification

Quality control in soil testing begins with a unique reference number/barcode on every sample bag. AGVISE will never ask you to write information on your soil sample bags. Deciphering unreadable handwriting is the first place mistakes happen. With the barcoded reference number on each sample bag, we track samples from the moment they arrive, through the analysis process, and when results are entered into AGVISOR, our online soil reporting system. AGVISE has used barcode reference numbers to identify soil samples for over 30 years. Since 2010, we have also offered online soil sample submission. The online submission system is another way to reduce errors because the customer can send the correct data directly to the laboratory. With online submission, there is no worry of misreading handwritten information!

When your soil samples arrive, we scan the barcode sticker and record its unique reference number, confirming it has reached the laboratory. Soil samples are dried overnight and ground the next morning. It is important to homogenize the soil sample through grinding and blending to ensure that what is analyzed represents the entire field, zone, or grid that was sampled.

Quality control in the laboratory

Soil analysis requires skilled technicians and calibrated instrumentation.  Each soil analysis is done following accepted methods for soils in our region and supported by university soil test calibration research.  When a soil test is performed (e.g. nitrate-nitrogen), quality control samples or “check samples” are tested along with customer samples to ensure accuracy and precision. The “check soil” has verified nutrient levels so we know what test value to expect every time. If a check soil value is outside the accepted range, all analysis from that group of samples is retested after the issue is corrected.  A check soil is tested after every ten customer samples. Therefore, ten percent of all soil tests done in the laboratory each day are quality control samples!  This past year, AGVISE used over 2,000 pounds of check soil in our quality control program to ensure you are receiving accurate data to make soil fertility decisions with.

Quality control – Laboratory proficiency and certification programs

AGVISE Laboratories in Northwood, ND and Benson, MN participate in three proficiency testing programs: the National Proficiency Testing program (NAPT), the Agriculture Laboratory Proficiency (ALP) program, and the Minnesota Department of Agriculture Manure Analysis Proficiency program. Our laboratories are also approved by the NAPT-Performance Assessment Program (PAP) and are certified soil and manure testing laboratories by the Minnesota Department of Agriculture. The Benson, MN laboratory is also an Iowa Department of Agriculture certified soil testing laboratory.

The proficiency programs send double-blind samples throughout the year to AGVISE. The samples are tested and results are evaluated by the proficiency programs for accuracy. Approval from PAP means that AGIVSE uses PAP approved methods to conduct soil analyses, which are required for NRCS programs. AGVISE has been involved with the NAPT proficiency testing program since it started in 1983.  As a longtime participant, AGVISE has had committee representatives on the NAPT Oversight Board for many years, striving to make the program better each year.

Quality control has been and will continue to be a priority for AGVISE Laboratories. When you receive a soil test report from AGVISE, you can be sure you are receiving the most accurate data possible.

More information about soil test certification and proficiency programs:

Agricultural Laboratory Proficiency Program (ALP)

Iowa Department of Agriculture Certified Soil Testing Laboratories

Minnesota Department of Agriculture Certified Manure Testing Laboratories

Minnesota Department of Agriculture Certified Soil Testing Laboratories

North American Proficiency Testing Program (NAPT)

Performance Assessment Program (PAP)


Phosphorus and the 4Rs: The progress we have made

The year 2019 marked the 350th anniversary of discovering phosphorus, an element required for all life on Earth and an essential plant nutrient in crop production. Over the years, we have fallen in and out of love with phosphorus as a necessary crop input and an unwanted water pollutant. Through improved knowledge and technologies, we have made great progress in phosphorus management in crop production. Let’s take a look at our accomplishments!

Right Rate

Phosphorus fertilizer need and amount is determined through soil testing, based on regionally calibrated soil test levels for each crop. Soils with low soil test phosphorus require more fertilizer to optimize crop production, whereas soils with excess soil test phosphorus may only require a starter rate. Across the upper Midwest and northern Great Plains, soil testing shows that our crops generally need MORE phosphorus to optimize crop yield (Figure 1), particularly as crop yield and crop phosphorus removal in grain has increased. Since plant-available phosphorus varies across any field, precision soil sampling (grid or zone) allows us to vary fertilizer rates to better meet crop phosphorus requirements in different parts of the field.

For phosphorus and the 4Rs article

Figure 1. Soil samples with soil test phosphorus below 15 ppm critical level (Olsen P) across the upper Midwest and northern Great Plains in 2019.

Right Source

Nearly all phosphorus fertilizer materials sold in the upper Midwest and northern Great Plains are some ammoniated phosphate source, which has better plant availability in calcareous soils. Monoammonium phosphate (MAP, 11-52-0) is the most common dry source and convenient as a broadcast or seed-placed fertilizer. Some new phosphate products also include sulfur and micronutrients in the fertilizer granule, helping improve nutrient distribution and handling. The most common fluid source is ammonium polyphosphate (APP, 10-34-0), which usually contains about 75% polyphosphate and 25% orthophosphate that is available for immediate plant uptake. Liquid polyphosphate has the impressive ability to carry 2% zinc in solution, whereas pure orthophosphate can only carry 0.05% zinc. Such fertilizer product synergies help optimize phosphorus and micronutrient use efficiency.

Right Time

Soils of the northern Great Plains are often cold in spring, and early season plant phosphorus uptake can be limited to new seedlings and their small root systems. We apply phosphorus before or at planting to ensure adequate plant-available phosphorus to young plants and foster strong plant development. In-season phosphorus is rarely effective as a preventive or corrective strategy.

Right Place

Proper phosphorus placement depends on your system and goals. Broadcasting phosphorus fertilizer followed by incorporation allows quick application and uniform distribution of high phosphorus rates. This strategy works well if you are building soil test phosphorus in conventional till systems. In no-till systems, broadcast phosphorus without incorporation is not ideal because soluble phosphorus left on the surface can move with runoff to water bodies.

In no-till systems, subsurface banded phosphorus is more popular because phosphorus is placed below the soil surface, thus less vulnerable to runoff losses. In general, banded phosphorus is more efficient than broadcast phosphorus. In the concentrated fertilizer band, less soil reacts with the fertilizer granules, thus reducing phosphorus fixation, allowing improved plant phosphorus uptake. Some planting equipment configurations have the ability to place fertilizer near or with seed, which further optimizes fertilizer placement and timing for young plants.

For more information on 4R phosphorus management, please read this excellent open-access review article: Grant, C.A., and D.N. Flaten. 2019. J. Environ. Qual. 48(5):1356–1369.

AGVISE Laboratories: Trusted by University and Industry Researchers

While you may know AGVISE Laboratories for the soil and plant analysis services we provide you and your producers, AGVISE also has a long history of supporting university and industry research. For the past 30 years, many university-operated soil testing laboratories have closed in the region. This has left a gap in the on- and off-campus research capacities at some institutions. To help bridge the gap, AGVISE partners with university and industry researchers to provide the laboratory analysis services they need to further research in soil fertility, plant nutrition, nutrient use efficiency, and many other areas. Researchers choose AGVISE for their research projects because of our reliability, consistence, and standard of excellence.

Each year, AGVISE analyzes thousands of soil and plant samples for researchers across the United States and Canada. You may have even heard of some recent research projects for which we provided the analysis services. A unique collaborative project was the Public–Industry Partnership for Enhancing Corn Nitrogen Research, which included eight land-grant universities and USDA-ARS. AGVISE analyzed thousands of soil and plant samples for researchers from the University of Illinois, Purdue University (Indiana), Iowa State University, University of Minnesota, University of Missouri, University of Nebraska, North Dakota State University, and University of Wisconsin. We are proud of our small part in support of this research that provided critical information to corn producers and helping them improve nitrogen management. You can read more about the project in the links below.

Another research project that AGVISE is helping with is the Potato Soil Health Project, supported by USDA-NIFA Specialty Crop Research Initiative (SCRI) and spearheaded by the potato industry. The research project includes eight potato-growing states across a range of diverse soils. In addition to soil fertility analysis, AGVISE is also helping evaluate soil health using biological activity (24-h CO2 respiration), active carbon (POXC), bioavailable nitrogen (ACE), and soil aggregate stability. AGVISE Laboratories is a strong supporter of soil health research, and we are excited to have been chosen to provide soil health analyses for the research project.

In addition to these large research projects, AGVISE also provides analysis services for many research organizations and universities throughout the region, including Agriculture and Agri-Food Canada, University of Manitoba, Montana State University, University of Saskatchewan, and South Dakota State University.

The next time you send your soil or plant samples to AGVISE Laboratories, you can be confident that you will be receiving the highest quality analyses and service, just like we provide to researchers across the United States and Canada.

Some open-access articles from AGVISE-supported university research projects

A Public-Industry Partnership for Enhancing Corn Nitrogen Research and Datasets: Project Description, Methodology, and Outcomes

When to Use a Single or Split Application of Nitrogen Fertilizer in Corn

Which Recommendation Tools Are Best for Achieving the Economically Optimal Nitrogen Rate?

The Potato Soil Health Project funded through USDA-NIFA SCRI


5 Things You Should Know About Phosphorus

1. The two accepted soil phosphorus tests in the North Central Region are the Olsen and Bray-P1 methods

The Olsen (bicarbonate) method is the standard soil P test in the North Central region. This method was developed to work on soils with low and high pH. The Olsen method works well in precision soil sampling, where the same field may have zones with acidic and calcareous soils. The Bray P-1 method is another accepted method in our region, but not always recommended. This method was developed in the U.S. Corn Belt, has a long history of soil test calibration studies and works well on acidic soils. The Bray P-1 method fails on soils with pH greater than 7, producing results with false low soil test P. Therefore, it has remained limited to the U.S. Corn Belt proper. The Mehlich-3 method was introduced as a multi-nutrient soil extractant. But like the Bray P-1 method, the acidic Mehlich-3 method does not perform well on calcareous soils; therefore, it has not gained approval by universities in the northern Great Plains and Canadian Prairies.

All soil P test methods are designed to predict the probability of crop response to P fertilization. The methods measure the plant-available P pool. Since the soil test method is an index of availability, the units are reported in parts per million (ppm) and ranked low, medium, or high based on university soil test calibration research. No soil P test method measures the actual pounds of available P in soil, they are only indexes of crop response.

 2. Most soils in the Northern Plains/Canadian Prairies region could use more phosphorus

Soils in the region are naturally low in P and historical P fertilizer use has been low, relative to crop P removal. As a result, many areas in the region still have low soil test P (below soil test critical level of 15 ppm Olsen P) after many decades of crop production. In other words, most farmers are not over-applying P. In fact, soils with low soil test P should receive moderate to high rates of fertilizer P each year to achieve good crop yield and maximize profitability.

Figure 1. Map developed using AGVISE soil test data. AGVISE has created regional summaries like this for the past 40 years. Check out the summary data for Montana and Canada and summaries of other nutrients and soil properties here.

3. You should use starter phosphorus fertilizer

Starter fertilizer placed near, or with the seed, is critical for crops like corn and wheat, regardless of soil test P level. A P fertilizer band placed near the seed will ensure soluble P near developing plant roots and results in vigorous early season growth, which is important in cold, wet soil conditions. Placing P fertilizer in bands also improves P use efficiency, especially in soils with relatively low or high pH. Phosphorus availability is greatest near soil pH 6.5. Since changing soil pH is difficult and costly, fertilizer P use efficiency is more easily improved with application in fertilizer bands to reduce the volume of soil involved in P fixation reactions.

4. Phosphorus source doesn’t really matter

No matter the starting material, all P fertilizers go through the same chemical reactions in the soil. It does not matter if the fertilizer starts as a poly-phosphate or ortho-phosphate. Within about one week in the soil, all P fertilizer sources react to form lower solubility compounds. What is more important than source is the placement of the fertilizer to increase availability (banding) and the rate of actual P fertilizer applied.

5. Phosphorus can be an environmental concern

Phosphorus entering surface waters can create algae blooms and fish kills. Since P is not mobile in soil, the P leaching risk is very low. However, P does move to surface waters with soil particles when erosion occurs. In cold climates like those on the northern Great Plains and Canadian Prairies, dissolved P released from vegetation can move with snow melt to surface water.

For more information about phosphorus and its reactions in soil, explore the links below:

Understanding Phosphorus in Minnesota Soils (Univ. Minnesota)

Understanding Plant Nutrients: Soil and Applied Phosphorus (Univ. Wisconsin)

Phosphorus Facts: Soil, plant, and fertilizer (Kansas State Univ.)


5 Things You Should Know About Calcium

1. Calcium (Ca) is abundant in soils of the upper Midwest, northern Great Plains, and Canadian Prairies; calcium deficiency in agronomic crops is rare

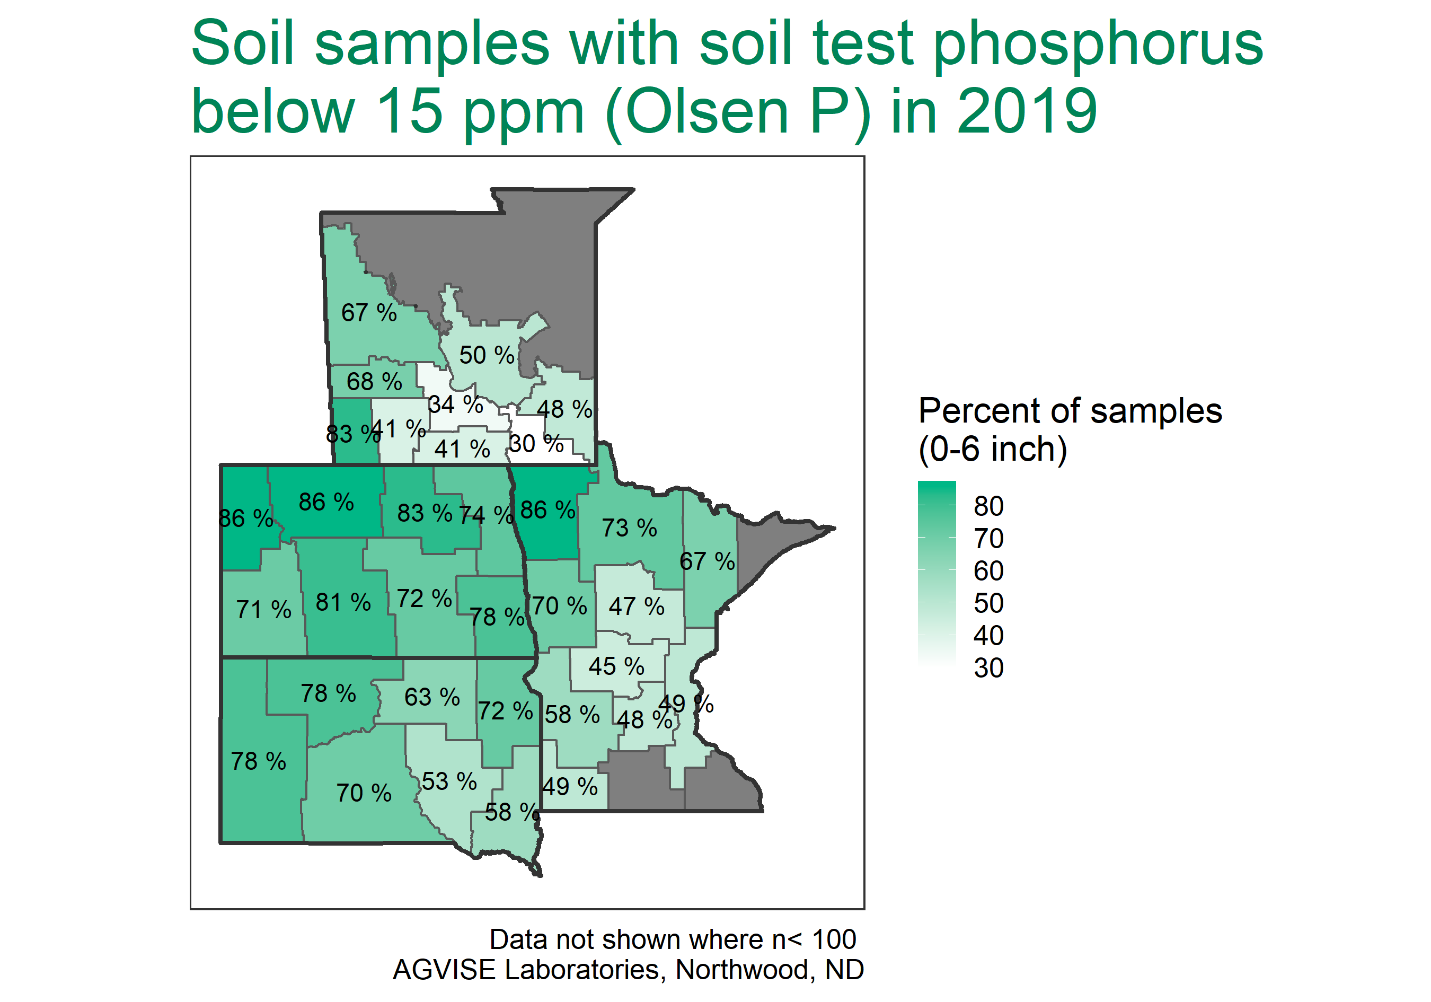
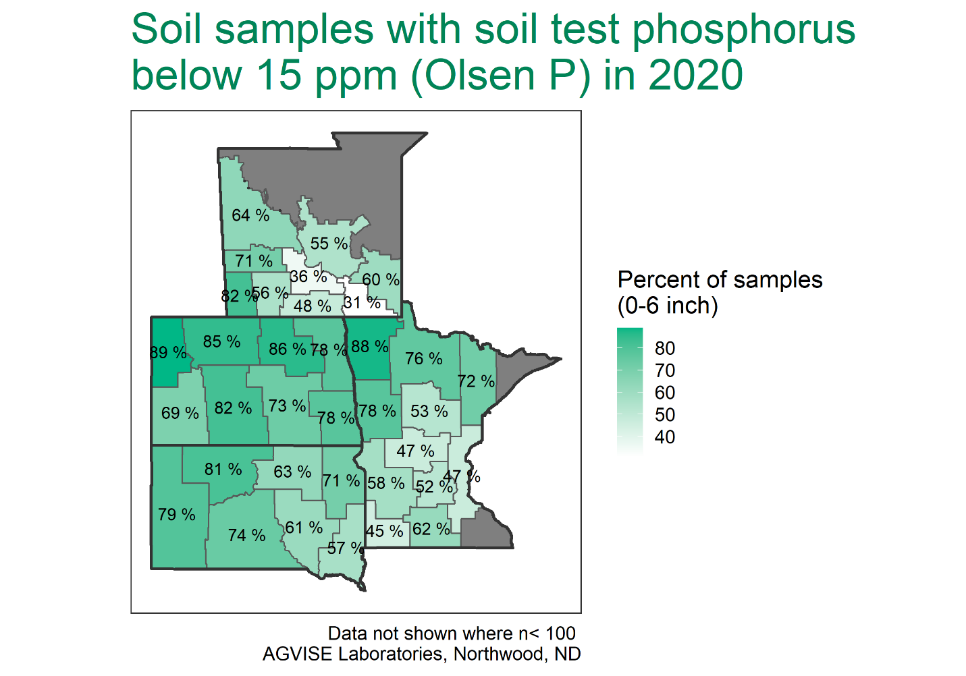
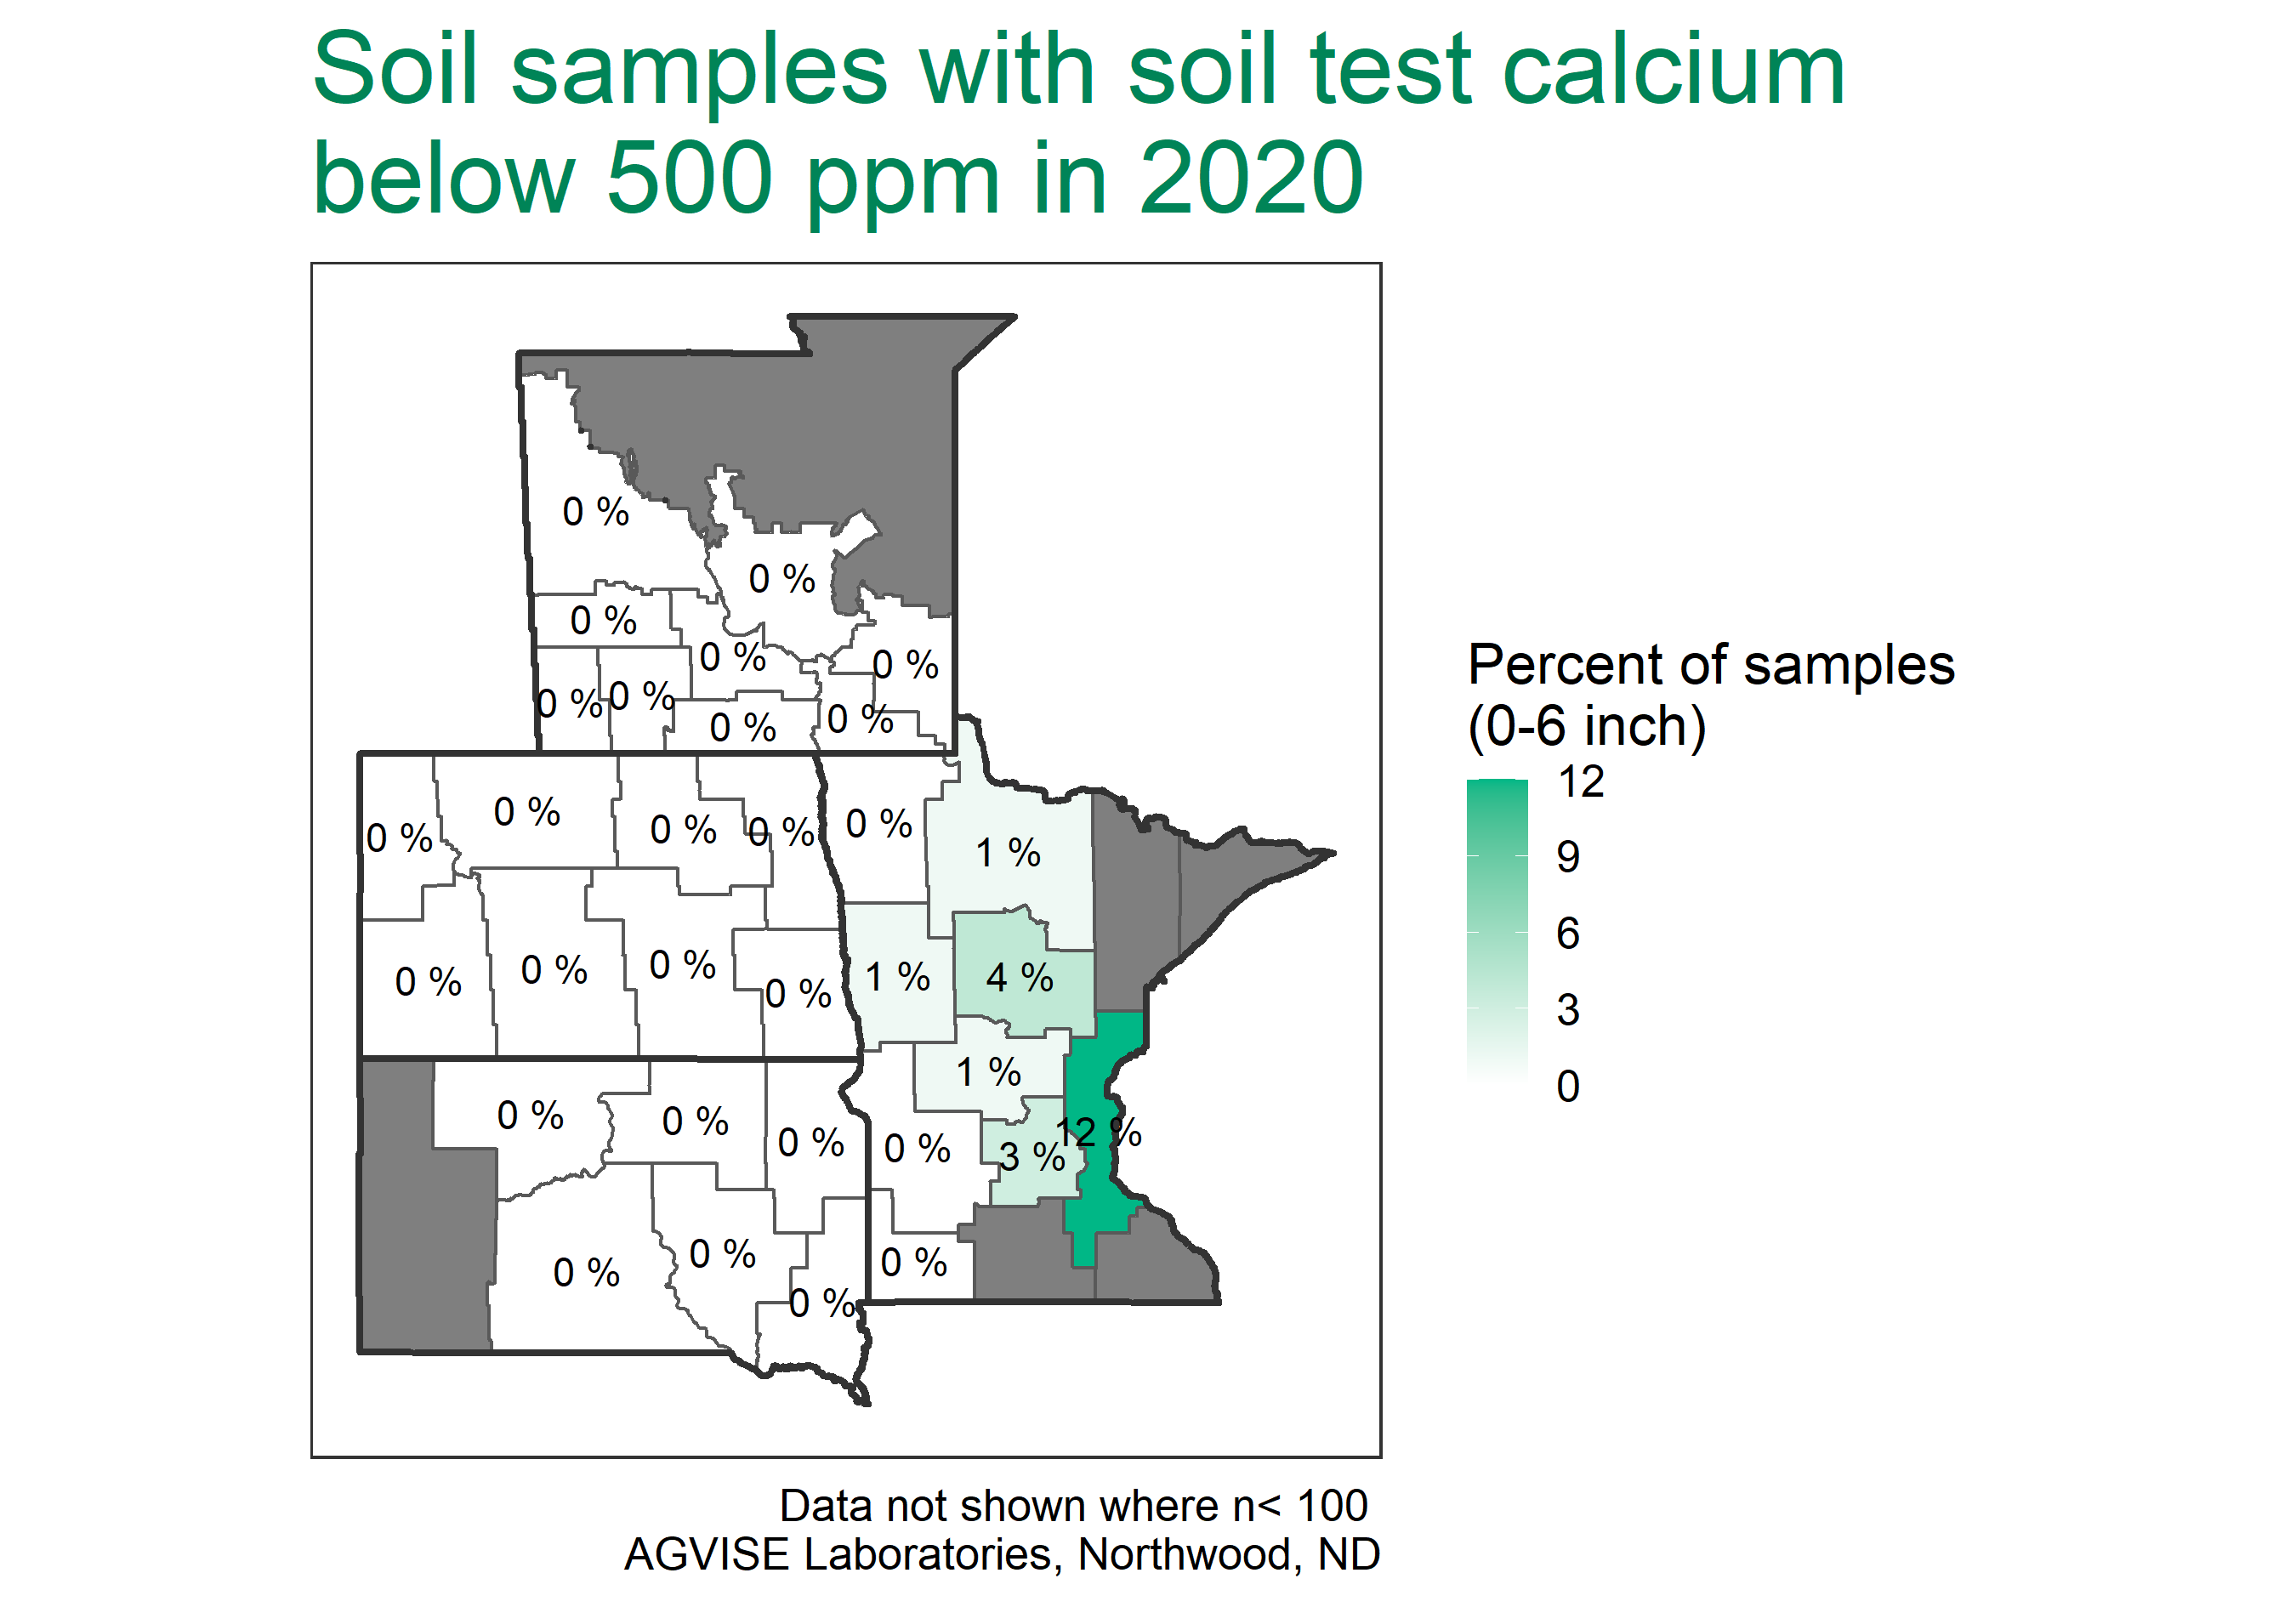
Calcium makes up about 3.6% of the Earth’s crust, and it is relatively abundant in agricultural soils across the region. In soils with pH greater than 6.0, Ca is the dominant cation (positively charged ion) on the cation exchange capacity (CEC). Since most soils in the region have a pH of 6.0 or above, calcium is very abundant and soils with low soil test Ca (less than 500 ppm) are rare (Figure 1).

Soil samples with soil test calcium below 500 ppm in 2020

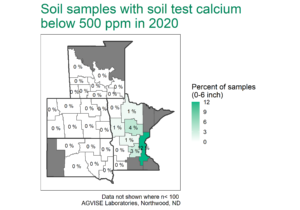
Figure 1. AGVISE regional soil test summary. AGVISE has created regional summaries for the past 40 years. You can find more soil test summary data, including Montana and Canada, here.

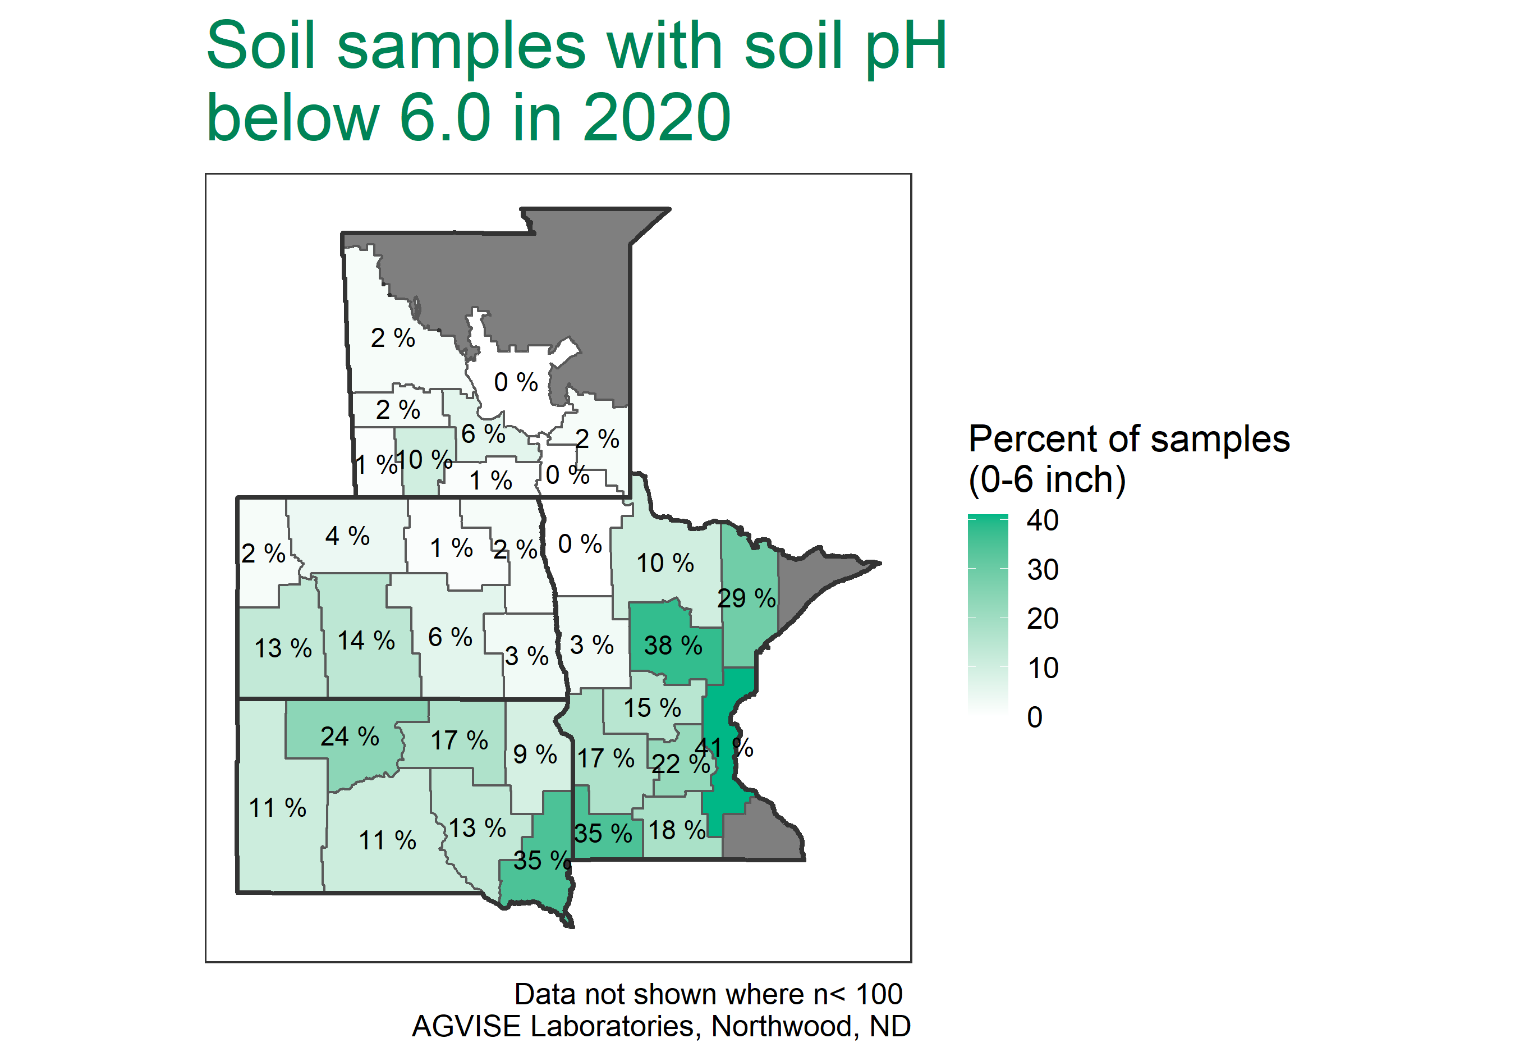
Potential calcium deficiencies are most common on sandy soils with strongly acidic pH (pH less than 5.0). Luckily, the fix for low soil pH also fixes potential Ca deficiencies. To correct soil pH, agricultural limestone is applied to raise soil pH to 6.0 or 6.5, if growing sensitive crops like alfalfa or clover. When limestone (calcium carbonate) is applied in tons per acre, more than enough calcium is also applied and sufficiently increases soil test Ca, providing ample calcium for optimal crop growth and development. Throughout the region, soils with low soil pH are more common in the higher rainfall areas to the east and south (Figure 2), and liming is a standard practice to correct soil pH and provide calcium.

Soil samples with soil pH below 6.0 in 2020, for 5 things you should know article

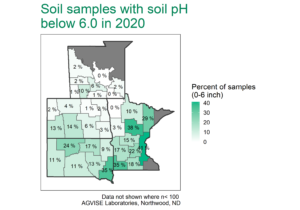
Figure 2. Soil samples with pH below 6.0 in 2020, where lime application may be required. The number of fields with low pH has increased over time and will continue to do so because soil acidification is a natural process. Keep watch for low soil pH, especially in western North Dakota and South Dakota. You can find more soil test summary data, including Montana and Canada, here.

2. Multiple calcium fertilizer sources exist; some increase pH, others do not

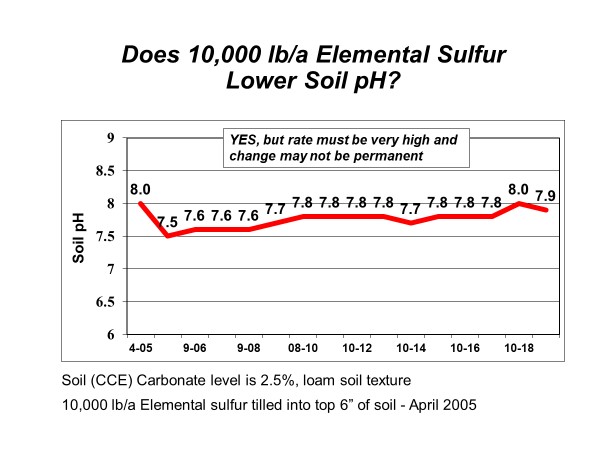
Agricultural limestone is the most common lime source and is available in two flavors: calcitic (calcium carbonate, <5% magnesium) or dolomitic (calcium-magnesium carbonate, >5% magnesium). Limestone quarries exist in southern Minnesota and Iowa, but the northern Great Plains is virtually devoid of mineable limestone. Industrial waste lime (spent lime) is another good lime source and available from sugar beet processing plants and water treatment plants throughout the region. Any of these liming materials will supply enough calcium to increase soil test Ca if soil pH is increased above pH 6.0.

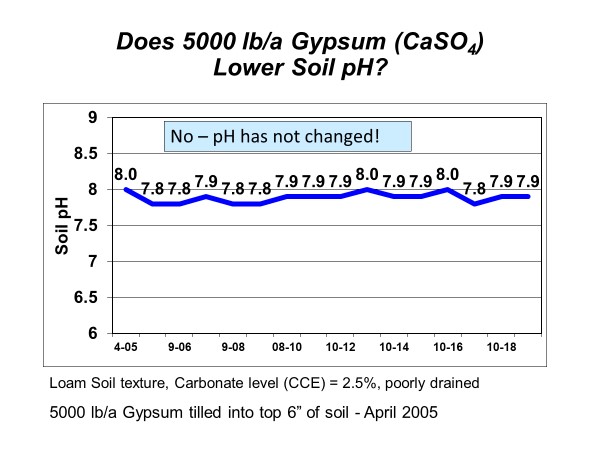
Gypsum (calcium sulfate) is another calcium source, but it does not change soil pH. Gypsum is sometimes used to increase soil test Ca if the producer does not want to increase soil pH with lime application. This situation is common in irrigated potato production where increased soil pH may increase soil-borne diseases like common scab of potato. Gypsum is not a lime source, so it will not increase soil pH.

3. There is no “ideal” base cation saturation range or ratio for calcium

Suggestions that Ca and other base cations (magnesium, potassium) are required in a certain percentage or ratio in soil are not supported by modern science. Recent research done at several universities shows a wide range of base cation ratios in soil will support normal crop growth (see links below). What is important is that a sufficient soil test amount of each base cation (Ca Mg, K) is present in soil to support plant growth and development.

4. Soils with pH greater than 7.3 will have falsely inflated soil test Ca and cation exchange capacity (CEC) results

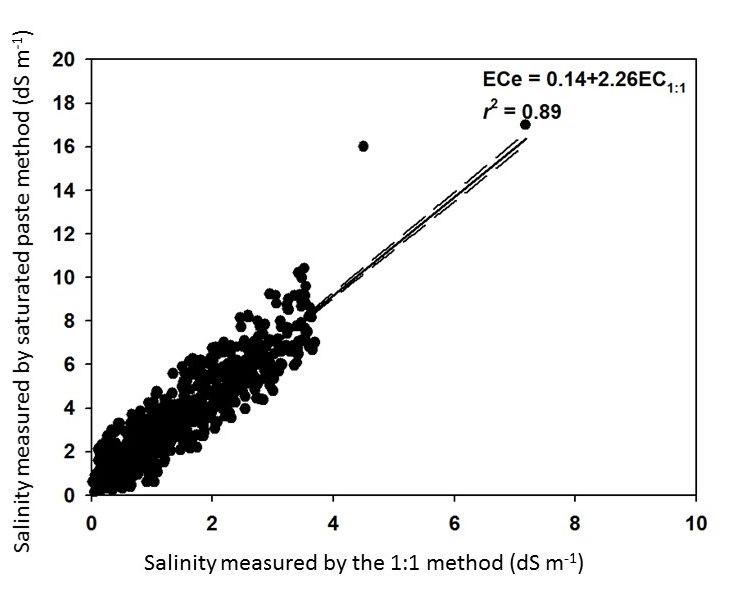
Soils with pH greater than 7.3 will contain some amount of naturally occurring calcium carbonate (CaCO3), shown on the soil test report as carbonate (CCE). The calcium soil test method will extract Ca on cation exchange sites and some Ca from calcium carbonate minerals, resulting in an inflated soil test Ca result. Starting with inflated soil test Ca, the routine cation exchange capacity (CEC) calculation is also inflated. For example, a soil with pH 7.8 and 3.0% CCE may report CEC at 60 meq/100 g, but the correct CEC is only 27 meq/100 g. To obtain accurate CEC results on soil with pH greater than 7.3, a special displacement CEC laboratory method is required. For soils with pH less than 7.3, the routine CEC calculation method will provide accurate soil test Ca and CEC results. High soil salinity (soluble salts, EC) can also inflate CEC results.

5. Calcium is not an environmental risk to surface or ground water

Calcium is one of the major dissolved substances found in surface and ground waters, especially in the northern Great Plains and Canadian Prairies. In fact, water hardness is determined from the amount of dissolved calcium and magnesium in water. There is already so much calcium found in natural waters in the region that calcium fertilizer additions to soil are negligible. Water hardness does affect the effectiveness of some herbicides and may cause tank-mixing issues, but is not an environmental concern.

Bonus: Just because your tomatoes have had blossom-end rot does NOT mean your soil is Ca deficient!

If you are a backyard tomato grower, you may have experienced blossom-end rot before, where the blossom-end of developing fruits turn brown and mushy while still on the plant. Yes, the problem is caused by low calcium in the tomato plant, but not necessarily because the soil has low soil test Ca. Blossom-end rot is primarily caused by inconsistent soil moisture. Adequate soil moisture is required to maintain a consistent supply of calcium moving to the plant root, which might run short if watering is inconsistent. To keep blossom-end rot away from your garden, just try to be more consistent with watering, especially during dry periods.

Resources on Base Cation Saturation Ratios

Cation Exchange: A Review, IPNI

Soil Cation Ratios for Crop Production, UMN

A Review of the Use of the Basic Cation Saturation Ratio and the “Ideal” Soil, SSSA Journal

High Soil Nitrogen following Drought: How to manage next year

From time to time, moderate to severe droughts hit the Great Plains. Such is life in semi-arid climates. When a drought occurs, it is normal to find higher residual soil nitrate-nitrogen after harvest. Since the widespread adoption of soil testing in the 1970s, we have seen this phenomenon in all major drought years: 1988, 2002, 2006, 2012, 2017 (Figure 1). The lack of precipitation and exhausted stored soil water reduces crop growth and yield, meaning much of the applied nitrogen fertilizer remains unused, showing up in the residual soil nitrate-nitrogen test. In 2017, very high residual soil nitrate-nitrogen was observed across wide geographies of western North Dakota and South Dakota (Figure 2).

Figure 1. Residual soil nitrate-nitrogen following wheat on the northern Great Plains.


Figure 2. Residual soil nitrate-nitrogen following wheat on the northern Great Plains in 2017.


Following a drought, we often get the question, “Can I count on all the soil nitrate in my soil test for next year’s crop?” The simple answer is yes; you can count on the amount of soil nitrate-nitrogen in the soil test, but you must consider additional factors. Even in drought, some parts of each field will produce higher crop yield than other parts because the better soils have higher water holding capacity (e.g. higher clay content, higher organic matter). In the high yielding zones, there is less residual soil nitrate remaining in the soil profile. Drought will create more variability in crop yield and residual soil nitrate, mostly driven by topography and soil texture.

Let’s imagine you had a wheat crop severely affected by drought, but some parts of the field still had 50% normal yield (maybe lower landscape positions, greater water holding capacity). Following harvest, the whole-field composite soil test showed 140 lb/acre nitrate-N (0-24 inch). You were skeptical about that very high residual soil nitrate level, so the crop consultant resampled the parts with better crop yield, which then had 80 lb/acre nitrate-N (0-24 inch). Using the whole-field composite soil test result of 140 lb/acre nitrate-N (0-24 inch), you would only need to apply some starter nitrogen fertilizer for next year’s crop. However, if you only applied starter nitrogen, the high yielding parts of the field with only 80 lb/acre nitrate-N (0-24 inch) would be under-fertilized, costing crop yield and profit next year, on the best soils in the field.

If you only have a whole-field composite soil test result, you must consider spatial variability in residual soil nitrate across the field. You will want to apply a base nitrogen fertilizer rate to cover the parts with lower residual soil nitrate than the field average. The base nitrogen fertilizer rate may range between 30 to 60 lb/acre N, depending on spatial variability and risk tolerance. If you do zone soil sampling, you have a much better idea of spatial variability and nitrogen fertilizer needs in all parts of your fields. Through productivity zone soil sampling, you know the residual soil nitrate level in each management zone, and you can choose different nitrogen fertilizer rates across the field.

If you only soil sample the surface soil depth (0-6 inch), you are missing 75% of the plant-available nitrate-nitrogen pie. To make good nitrogen decisions, you should collect 0-24 inch soil samples for soil nitrate-nitrogen analysis. In drought, plant roots explore deep for stored soil water and uptake whatever nitrate is found along the way. There is no way to model how much soil nitrate remains in the soil profile after drought. Following drought, the best strategy is 24-inch soil sampling and breaking fields into several management zones to determine the proper amount of nitrogen fertilizer required.