Zone Soil Sampling and Variable Rate Fertilization: Optimizing profits

This article originally appeared in the AGVISE Laboratories Winter 2022 Newsletter

Farmers, like all business owners, are profit maximizers: things are good when revenue exceeds cost. Things are even better when the difference between revenue and costs is substantial. The math behind increasing profit is simple: reduce costs, increase revenue. But, the difficult part is finding and implementing strategies on the farm to do this. Why not start with fertilizer, which is typically the largest annual input cost on the farm?

Your fields are variable. You know the hilltops have lower crop yields than the mid-slopes, and you know exactly how far the saline spots creep into the more productive part of the field. So why use the same rate of fertilizer in the unproductive areas as you would in the productive areas? Optimize your fertilizer inputs by reducing rates in low-yielding areas and reallocate those fertilizer dollars to the productive ground.

The North Field Zone Map

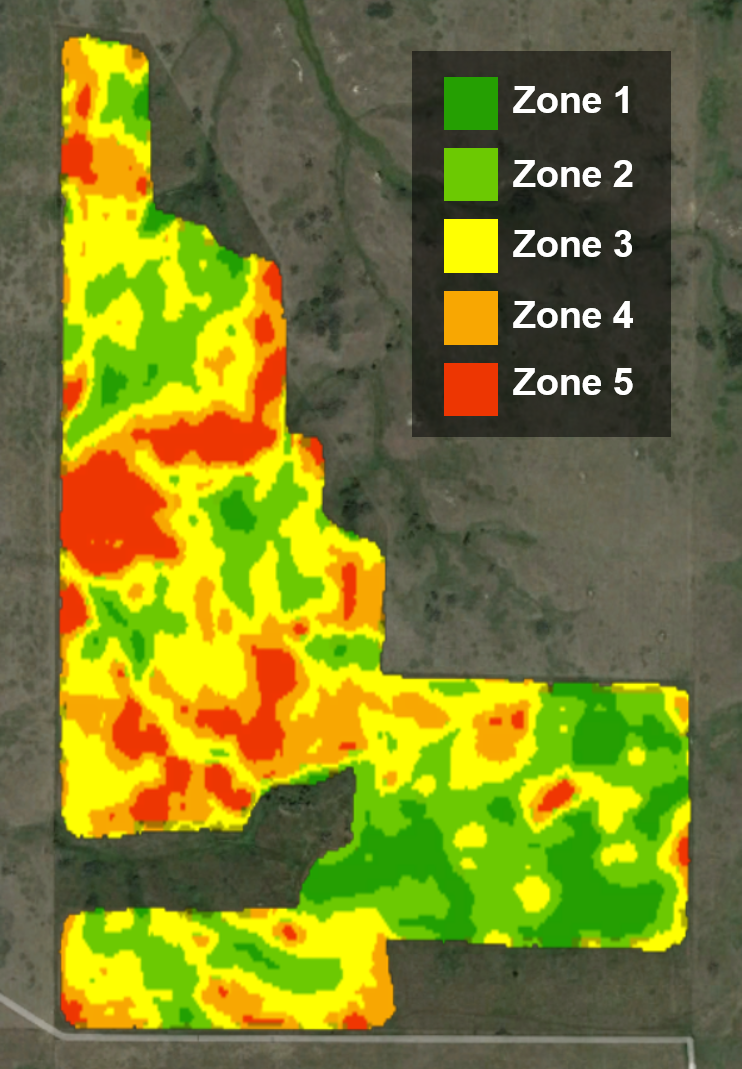
Figure 1. North Field zone map, created using ADMS from GK Technology.

How does one actually do this? Creating zone maps for your fields, soil sampling and testing based on productivity zones, and variable rate (VRT) fertilizer application is the place to start. Applying VRT fertilizer allows you to apply fertilizer where it is needed and not waste fertilizer dollars where it is not. Let me show you an example from my family’s farm in western North Dakota.

I farm with my dad and brother in southwest North Dakota. This past fall, I created zone maps for each of our fields, with help from GK Technology and their ADMS program. The final maps are based on historical satellite imagery. I will show you one of our fields, the North Field, and take a deep dive on nitrogen fertilizer optimization using zone soil sampling and VRT fertilization in the dryland “out west” country.

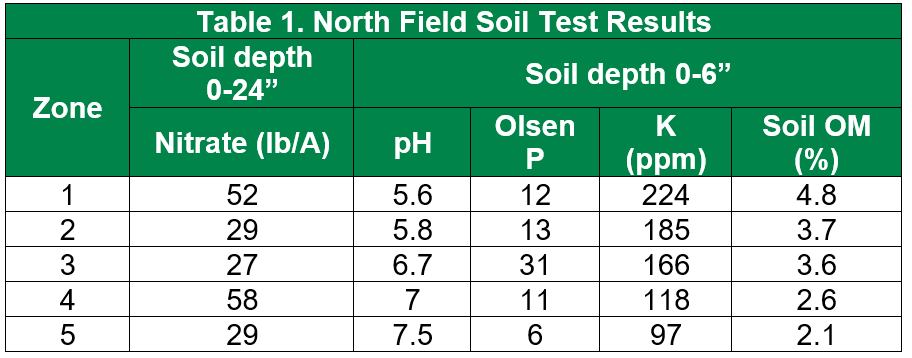
The North Field (Figure 1) is variable. That is expected on a 120-acre field with many hills and ravines (Table 1). For discussion, we will use residual soil nitrate-nitrogen results and make a nitrogen fertilizer plan using urea for hard red spring wheat (HRSW) in 2022. You can see the soil nitrogen data, crop yield goals, and final nitrogen rates in Table 2.


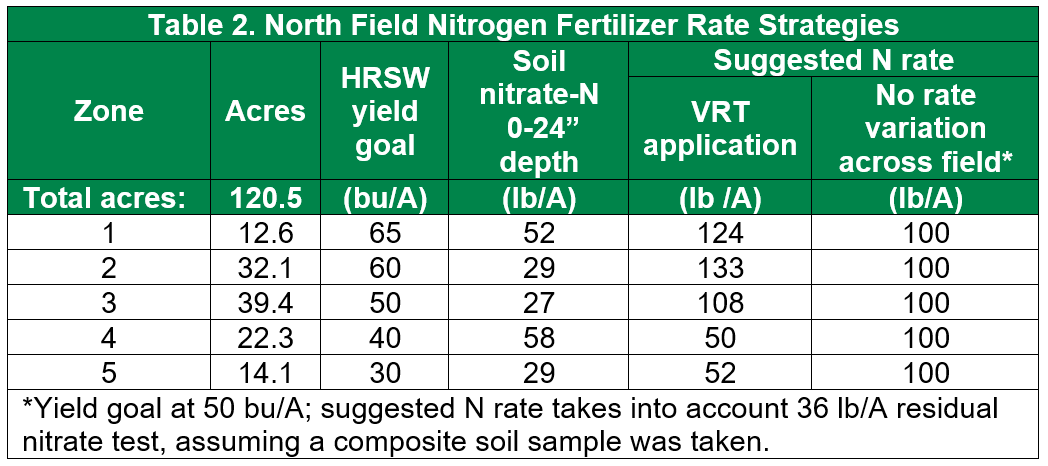
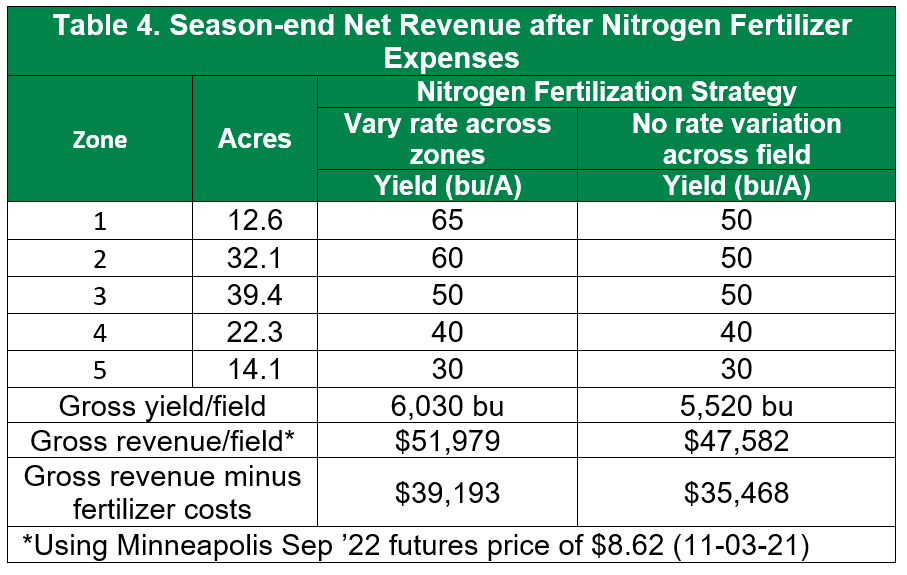
The first place to optimize fertilizer inputs is setting realistic crop yield goals for each zone. Spring wheat yield goals range from 65 bushel/ acre in the best zone (zone 1) to 30 bushel/acre on the hilltops (zone 5). Adjusting the nitrogen rate for the proper crop yield goal ensures that the high-producing zones are not limited by lack of nitrogen (increased fertilizer cost, increased revenue) and the low-producing zones are not overfertilized (decreased fertilizer cost, same revenue). With a responsible crop yield goal on the low-producing zones, the crop still receives the amount of nitrogen it requires, and excess nitrogen is not lost to nitrate leaching (wasted input cost). As a result, the excess nitrogen fertilizer is reallocated to high-producing zones, resulting in more crop yield with the same total fertilizer budget, and increased revenue.

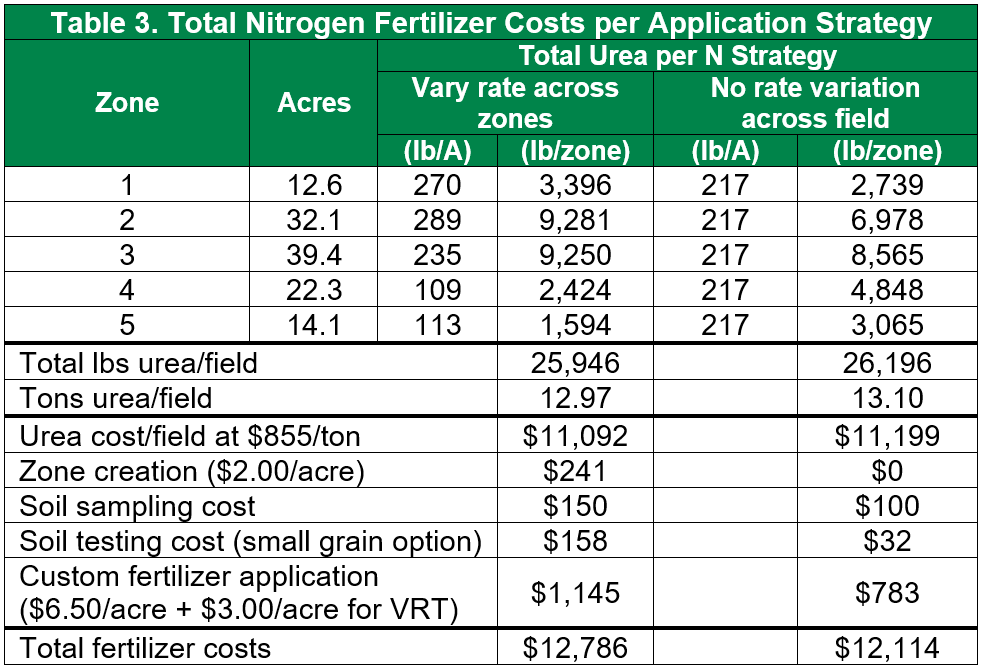
The nitrogen fertilizer scenarios in Tables 3 and 4 break down the projected revenues and expenses, demonstrating the benefits of zone soil sampling and VRT fertilization. For the North Field on my farm, the projected profit increase was $3,725 for the field or $31.05 per acre. It is tough to argue with a dollar amount like that! Prices will vary, of course, for fertilizer and precision ag services in your geography. Do the math for yourself and see how zone soil sampling and VRT fertilization can maximize profits for you.

2021 Drought: High residual soil nitrate-nitrogen across the region

This article originally appeared in the AGVISE Laboratories Winter 2022 Newsletter

The 2021 drought rivals the 1988 drought, and it covered much of the northern Great Plains and Canadian Prairies. From previous experience with droughts, we expected that residual soil nitrate-N following crops would be higher than normal, caused by the drought and reduced crop yields. The first wheat fields that were soil tested in August and September confirmed our expectation that residual soil nitrate-N was already trending much higher than normal.

The 2021 AGVISE soil test summary data highlights how exceptional the 2021 drought was. The median amount of soil nitrate-N across the region was markedly higher following wheat and corn. Over 20% of wheat fields had more than 100 lb/acre nitrate-N (0-24 inch) remaining, and another 40% of wheat fields had a sizable 40 to 80 lb/acre nitrate-N (0-24 inch) left over. For any given farm, the great variability in residual soil nitrate-N makes choosing one single nitrogen fertilizer rates impossible, and soil testing is the only way to decide that right rate for each field.

Through zone soil sampling, we were also able to identify that residual soil nitrate-N varied considerably within a field. This makes sense because we know that some areas of the field produced a fair yield, leaving behind less soil nitrate, while other areas produced very poorly and left behind much more soil nitrate. These differences across the landscape are driven by soil texture, soil organic matter, and stored soil water as well as specific problems like soil salinity or low soil pH (aluminum toxicity). Although the regional residual soil nitrate-N trends were higher overall, it is truly through zone soil sampling that we can begin to make sense of the field variability that drives crop productivity and the right fertilizer rate for next year.

For fields that have not been soil tested yet, there is still time to collect soil samples in winter (see winter soil sampling article). Nobody wants to experience another drought, but this kind of weather reminds us how important soil nitrate testing is every year for producers in the Great Plains. Each year, AGVISE summarizes soil test data for soil nutrients and properties in our major trade region of the United States and Canada. For more soil test summary data and other crops, please take a look at our soil test summaries online.


Banding Phosphorus and Potassium: Stretch your fertilizer dollars further

This article originally appeared in the AGVISE Laboratories Winter 2022 Newsletter

Broadcast or band? For phosphorus and potassium, these are big fertilizer questions. In recent months, high fertilizer prices have prompted farmers and agronomists to consider other strategies to reduce fertilizer costs without jeopardizing crop yield. Among the most common and effective options is placing fertilizer in a tight band below the soil surface, also known as a subsurface band.

Subsurface banding helps improve fertilizer recovery and efficiency. It ensures that fertilizer is placed in the plant root zone, facilitating direct uptake of crop nutrients. It also minimizes potential fixation reactions (aka tie-up) that reduce soil nutrient availability, allowing more phosphorus or potassium to remain available in soil for plant uptake. You ultimately get more bang for your buck on each pound of fertilizer applied. In addition, placing fertilizer below the soil surface protects fertilizer from

Idealized crop response to phosphorus as affected by fertilizer placement and soil test level (figure from J. Prod. Agric. 1:70-79).

soil erosion and runoff losses via wind and water. This is important for fall-applied phosphorus and potassium because spring snowmelt runoff and wind erosion can move fertilizer lying on the soil surface from neighbor to neighbor and watersheds beyond.

When we discuss banding phosphorus and potassium, it also comes along with the question, “How far can I cut fertilizer rates?” It is important to recognize that the improved efficiency of banding over broadcast is a function of soil test levels (figure) and proximity to the seed row. If you have high soil test levels (>15 ppm Olsen P), then the expected crop yield response to fertilizer, whether broadcast or banded, is lower. Banding fertilizer still helps with the fertilizer recovery, but the expected crop yield increase is often similar to broadcast. However, if you have low soil test levels, then the expected crop yield response is much greater with banding.

Where does seed row proximity fit in? The greatest efficiency comes with in-furrow or near-seed placement (e.g. 2×2 band), allowing effective fertilizer rates of one-half to two-thirds their broadcast equivalent. The near-seed placement also provides the starter effect, which enhances early plant growth and development in cool, wet soils of the upper Midwest and northern Great Plains. Of course, you must watch seed safety with any seed-placed fertilizer in the furrow.

For deep-band or mid-row band placement, the benefits over broadcast begin to disappear. These are still great placement options for anhydrous ammonia or urea, but the greater distance between the seed row and fertilizer band does not provide the same efficiency for immobile soil nutrients like phosphorus and potassium. This will surprise some people hoping that strip-till with deep-banded phosphorus and potassium or a one-pass air seeder with mid-row banders might be their answer to reducing fertilizer costs. For these “far-from-seed” banding options, reduced fertilizer rates are not suggested, and some in-furrow or near-seed banded fertilizer should still be applied for the current crop.


Controlling Soybean Cyst Nematode: Do you have a resistance problem?

This article originally appeared in the AGVISE Laboratories Winter 2022 Newsletter

This is the third year of our soybean cyst nematode (SCN) resistance project. Each year, we have flagged spots in soybean fields and collected paired SCN soil samples in June and September. If the SCN egg count increases through summer and into fall, we can quickly learn if the soybean SCN-resistance source, either PI88788 or Peking, is working or failing. University SCN surveys have found that the PI88788 resistance source has begun to lose its effectiveness at controlling SCN populations in much of Minnesota. This is a particular problem because 95% of SCN-resistant soybean varieties still use the PI88788 resistance source.

SCN egg count and soybean yield data from the 2021 AGVISE SCN resistance project. Bars of the graph represent SCN egg count, lines of the graph represent soybean yield. Click on the graph for a higher resolution version.

In 2021, paired soybean variety comparisons with SCN soil samples and soybean yield data really helped us see the difference in these SCN resistance sources. Among the sites, the Peking resistance source always had a lower SCN egg count than the PI88788 comparison, indicating that the Peking soybean varieties had better control of the SCN population at 4 of 5 sites. The Alberta site had similar SCN population control with both PI88788 and Peking resistance sources, so the soybean yield was similar at the site. However, the other sites demonstrated SCN resistance to PI88788, and the resulting soybean yield with the Peking resistance source was better with 7-bu/acre soybean yield increase on average.

For 4 of 5 sites, it is apparent that a Peking-traited soybean variety is the better choice. To learn if you have SCN resistance problems in your field, the simple early-late SCN soil sampling exercise, like we did in this project, is a quick way to learn if your current soybean variety is still controlling SCN and delivering the best soybean yield.