Choosing the Right Phosphorus Method

This article originally appeared in the AGVISE Laboratories Spring 2023 Newsletter under President’s Corner

The phosphorus soil test debate never ends. Should I use the Olsen test, or maybe Bray-1 would be better? What about the Mehlich-3 method, and should that extract be analyzed on an ICP or with a colorimetric method? Perhaps, Bray-2 or the Haney extractable P is something to consider? This whole phosphorus test dilemma can be quite confusing; however, the answer is quite simple. Use the soil phosphorus test that is calibrated for your region!

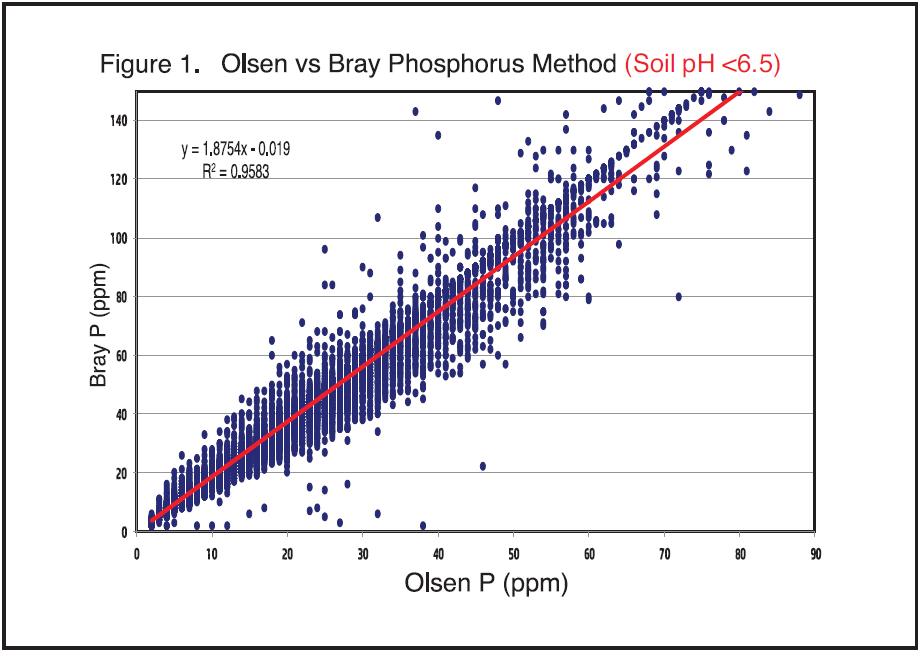
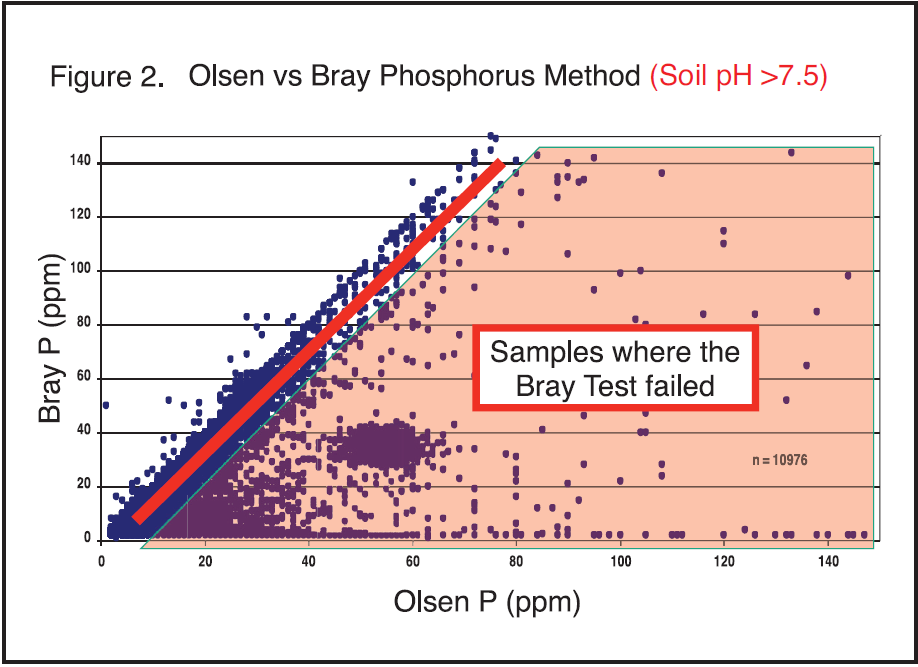
In the upper Midwest, the Olsen test is the most reliable method to determine phosphorus availability and has the most correlation and calibration data with field trials. Many hours have been spent by university researchers putting out field trials to determine phosphorus fertilizer rates for various crops. The researchers have evaluated various phosphorus methods, and the two most common methods are the Bray-1 and Olsen extractants. The Bray-1 method is the older method, developed in Illinois. It works well on soils with pH below 7.3. Once the soil pH is above 7.3, the extractant may fail. If the test fails, it will produce a result near zero.

The Olsen method is required on calcareous soils (pH > 7.3), but it also works well on acidic soils. There is a common misconception that the Olsen method is only suitable on calcareous soils. In fact, the Olsen method is widely used across the world because of its versatility on acidic and calcareous soils. It is a perfect fit for our region because it works so well across a wide soil pH range and on diverse soil types. In the AGVISE Newsletter Spring 2017 issue, retired AGVISE President Robert Deutsch compiled soil test data for the Bray-1 and Olsen methods with over 25,000 soil samples. The graphs highlight how robust the Olsen phosphorus method is, working on acidic and calcareous soils alike.

The Mehlich-3 method has gained popularity in the southeast United States and the central Midwest. In these regions, the soils are more weathered and often do not have problems with high calcium carbonate content. At the University of Minnesota, Dr. Dan Kaiser has worked on Mehlich-3 method correlation on Minnesota soils for quite a few years. For some soils, the Mehlich-3 method performed as expected, while some others had Mehlich-3 results 8 to 10 times higher than expected. For these reasons, the Mehlich-3 method has not been approved for use in the upper Midwest or northern Great Plains.

As of this time the only phosphorus soil tests recommended for soils in the upper Midwest are the Olsen and Bray-1 extracts. If someone mentions using any other phosphorus soil test, it has not been tested or correlated to the soils in this region.

Are Soybean Iron Deficiency Chlorosis (IDC) Ratings Getting Worse?

This article originally appeared in the AGVISE Laboratories Spring 2023 Newsletter

For the past three years, we have seen severe and widespread soybean iron deficiency chlorosis (IDC) symptoms across the region. In fact, some seasoned agronomists have commented that 2022 was the worst soybean IDC year that they had experienced in decades. Soybean IDC is a serious risk on soils with high calcium carbonate or salinity, which interfere with iron uptake and utilization in soybean. With all that we have learned about soybean IDC risk and management over the past 30 years, we have to ask, “What is going on? Why is soybean IDC continuing to get worse?”

The NDSU soybean IDC trial data suggests it might be the soybean varieties. Each year, seed companies submit soybean varieties to NDSU for independent evaluation of soybean IDC ratings (https://www.ag.ndsu.edu/varietytrials/). The NDSU trial sites impose high soybean IDC risk, where the best and worst soybean varieties are thoroughly tested alike for soybean IDC tolerance. In recent years, the problem is that the year-after-year average soybean IDC rating continues to get worse (see figure). In 2022, the average soybean variety scored 3.5 on the NDSU scale (1-good, 5-bad). Adverse soil and weather conditions may explain part of the worsening problem in the NDSU trials, but it is apparent that few soybean varieties can handle severe soybean IDC on their own. In defense of soybean breeders, there are a lot of different breeding objectives on their plates right now, including herbicide tolerance packages, disease and insect pests, and seed yield, of course!

This means we need to revisit and use all of our options in the soybean IDC toolbox. We have known about these effective management tools for over 20 years, and we are going to need to use all of them until soybean variety IDC tolerance can get to where we need it.

Steps to better soybean IDC management

  • Soil test each field, zone, or grid for carbonate and salinity to evaluate soybean IDC risk potential.
  • Plant soybean in fields with low soybean IDC risk. Choose a tolerant soybean variety, if you can. Some high IDC-risk fields may not be suitable for soybean.
  • Use a chelated iron fertilizer (high-quality EDDHA or HBED chelate) with seed at planting. Liquid and dry products are now available.
  • Plant soybean in wider rows. Soybean IDC tends to be less severe in wider rows.

Two Graphics You Should Know Before the 2023 Growing Season

This article originally appeared in the AGVISE Laboratories Spring 2023 Newsletter

The goal of AGVISE Newsletters is to inform you and your customers of important soil fertility information relevant to our area. Often, visuals or graphs are much more powerful at communicating a message than words. With that in mind, I want to share two figures I think you should know about going into the 2023 growing season with a short synopsis and where you can find more information on the topic.

Adapted from the “Biostimulants” episode of the University of Minnesota Extension Nutrient Management Podcast https://nutrientmanagement.transistor.fm/episodes/biostimulants-52305fc9-6c01-4907-8507-2bcf4c708a08

Right now, there are many biological products and fertilizer additives on the market. In particular, asymbiotic nitrogen-fixing products have gained a lot of attention, but many have little or no university research evaluating them. Any grower wanting to try new products should test them on a small acreage first, before adopting them across the whole farm. To the left is a diagram of how such an on-farm trial would look. The key factors of a meaningful on-farm trial include a control treatment (the standard practice), the standard practice plus the product, and randomized replication (at least three replicates, randomized so that one treatment is not always on the east or west side of the trial area).

If the standard nitrogen rate will be reduced when the product is used, a treatment should also be included that compares the same reduced nitrogen rate without the product (this three-treatment setup is what is pictured). If the standard nitrogen rate is higher than the crop N requirement, maybe if you do not have a current soil nitrate-N test or just general overapplication, a reduced nitrogen rate plus the product that produces the same crop yield as the standard practice does not mean that the product is producing additional nitrogen for the crop; it may just mean that the grower can cut back their standard nitrogen rate.

Slide from Dr. John Jones’ 2023 AGVISE Seminar presentation, Phosphorus and Potassium: A Fresh Look with Fresh Data https://www.agvise.com/resources/seminars-and-events/

With fertilizer prices remaining high, it is tempting to cut back phosphorus and potassium inputs to save money. As tempting as this is, do not cut back farther than the fertilizer rates needed to meet the critical soil test level, as optimum soil-test P and K levels are required to achieve the highest response from nitrogen fertilizer. While working to update the Wisconsin phosphorus and potassium fertilizer guidelines, Dr. John Jones at the University of Wisconsin has put together some excellent data illustrating the reality of Liebig’s Law of the Minimum: when P and K fertility needs are unmet, the return from nitrogen fertilizer investment will be reduced compared to when P and K are at optimum levels. This means pouring on more nitrogen will not increase crop yield unless you are doing a good job of managing P and K too. Although not shown here, Dr. Jones also has data showing that corn and soybean yield response to P is reduced when K fertility needs are unmet.

John Breker Appointed to NAPT Oversight Committee

This article originally appeared in the AGVISE Laboratories Spring 2023 Newsletter

John Breker was appointed to the North American Proficiency Testing Program Oversight Committee as the North Central Region representative, starting in January 2023. The North American Proficiency Testing (NAPT) Program assists soil, plant, and water laboratories with quality control and quality assurance through inter-laboratory sample exchanges as well as statistical evaluation of the analytical data. These tools help laboratories generate accurate and precise analyses, as well as provide confidence to clients that their data meets high standards.

The NAPT program guidelines have been developed for the agricultural laboratory industry by groups involved with standardizing soil and plant analysis methods in the United States and Canada. The program is authorized through the Soil Science Society of America (SSSA) and administered by the NAPT Oversight Committee, composed of representatives from regional soil and plant analysis workgroups, state/provincial departments of agriculture, and private and public soil and plant analysis laboratories.

AGVISE Laboratories has been a member of the NAPT program since its inception. AGVISE Laboratories in Benson, MN and Northwood, ND participate in the soil, plant, and water programs through NAPT, as well as the Performance Assessment Program (PAP) required for participation in USDA-NRCS programs. AGVISE is a strong supporter of NAPT and the ongoing objectives of the NAPT program.

NAPT Program Objectives

  • Provide an external quality assurance program for agricultural laboratories
  • Develop a framework for long-term improvement of quality assurance for the agricultural laboratory industry
  • Identify the variability of specific methods


High Fertilizer Prices? Using Crop Removal P & K Rates is an Expensive Choice

This article originally appeared in the AGVISE Laboratories Spring 2023 Newsletter

If you thought high fertilizer prices would resolve after one or two years, it is looking like those prices are becoming the new norm. At such prices, every fertilizer dollar you spend must be spent to guarantee the best bang for each buck. This means soil testing makes more dollars and sense than ever.

Phosphorus and potassium are best managed with current soil test information to maximize crop yield potential and profitability. Yet, some people continue to apply phosphorus and potassium at crop removal (CR) rates as a way to maintain the soil fertility status quo. This is a major oversight because CR-based rates maintain soil fertility in a way that overapplies fertilizer to parts of the field with high soil test P or K that do not need more fertilizer, yet underapplies fertilizer to parts with low soil test P or K and ultimately sacrifices crop yield. This is particularly troublesome if the factor that limited crop yield was one of those nutrients! As a result, the reduced crop yield leads to a lower CR-based fertilizer rate that fails to fix the soil fertility issue, and you stay in a low soil fertility rut. For example, if soil test P is very low and limits crop yield, a crop removal-based P rate will undershoot the actual crop P requirement, resulting in reduced crop yield and continued nutrient mining year after year. A soil test-based P rate will show you exactly where more fertilizer is required to maximize crop yield and where you can reduce fertilizer rates to maximize profitability.

Another serious reason to avoid CR-based rates is the risk of off-site nutrient losses, especially phosphorus. When CR-based rates are applied on soils with high or very high soil test P, this increases the risk for environmental P loss to waterways that can degrade water quality and result in regulatory oversight. Precision soil sampling (grid or zone) and soil test-based fertilizer rates is the best way to maximize crop yield, profitability, and protect the environment.