Early Soil Nitrate Trends after Wheat in 2022

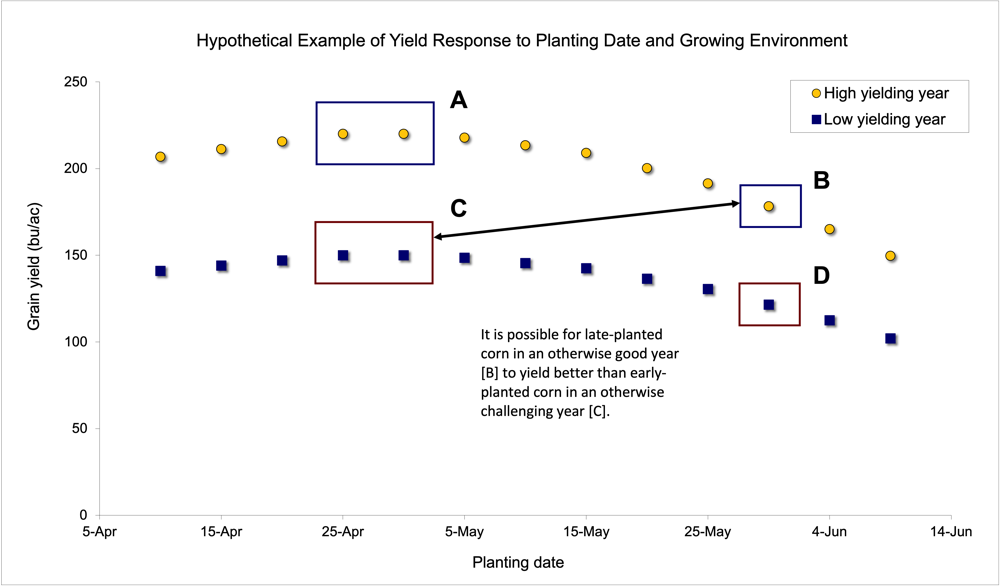
Small grain harvest is well underway across the region, and soil testing is progressing quickly. Crop yields have varied from below average to exceeding expectations across the region and often in the same area. Planting date, summer temperatures, and rainfall (too little or too much) were major factors this year.

The major factors influencing the amount of residual soil nitrate-N after crops are:

1.     Nitrogen fertilizer rate: too high or too low
2.     Crop yield achieved: much lower or higher than expected
3.     Nitrogen losses: denitrification and leaching after too much rainfall
4.     Nitrogen mineralization from organic matter: cool or warm growing season

Seasonal weather is a large driving factor in the amount of nitrate-N in the soil profile. This changes from field to field and year to year. Early spring weather conditions were very wet across much of the region. In June and July, some areas continued to receive adequate to excess rainfall. Meanwhile, other areas received very little rain in the late growing season.

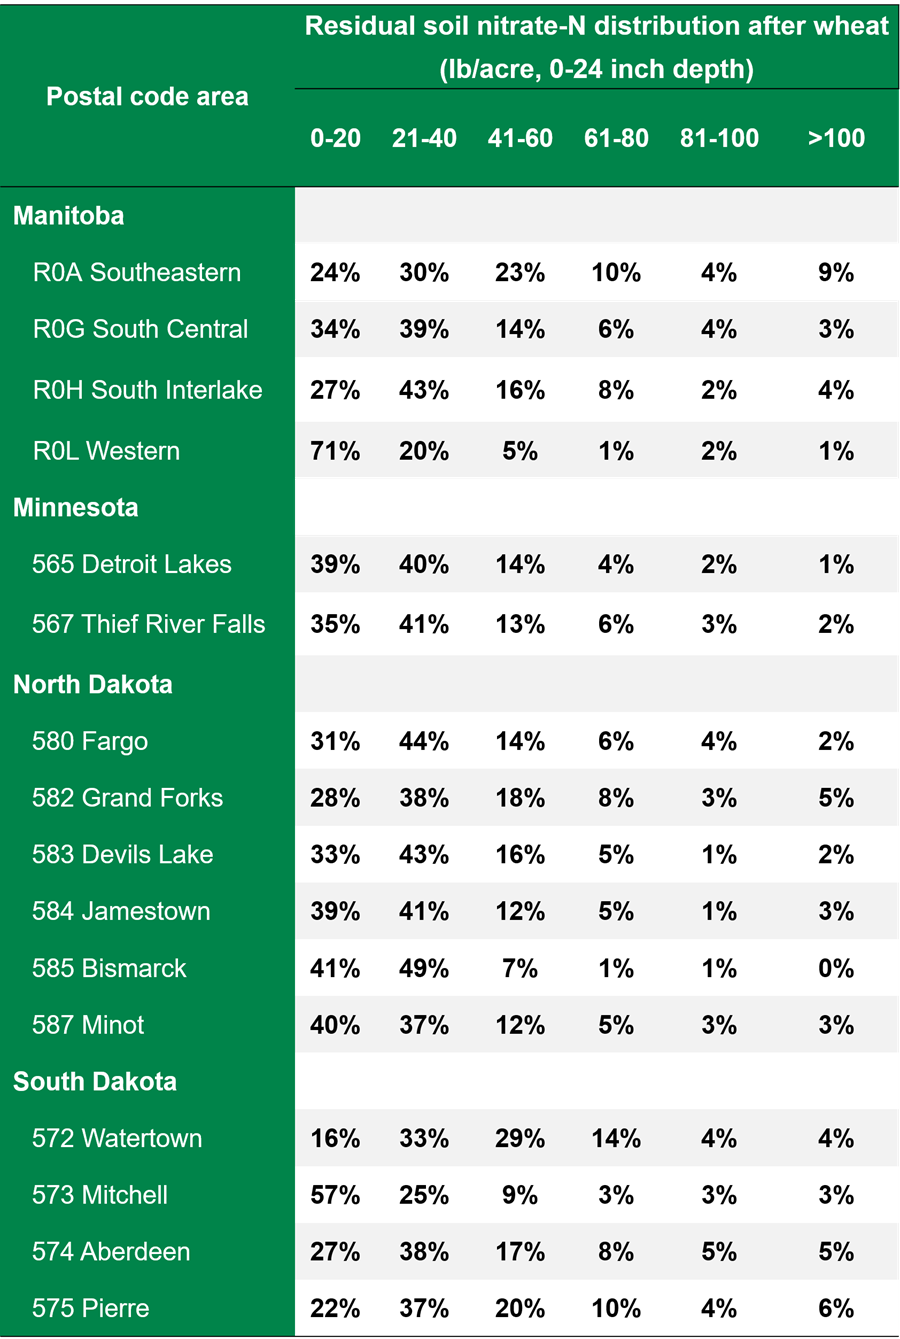
AGVISE has tested over 10,000 soil samples from wheat fields across the region. The table below indicates the percentage of soil samples in each soil nitrate-nitrogen category in several areas of Manitoba, Minnesota, North Dakota, and South Dakota. The data should give you a general idea of how variable residual soil nitrate is from field to field in each region. With such variable crop yields, there is quite a bit of variability in residual nitrate following wheat in the region. In drought-affected areas of Minnesota, North Dakota, and South Dakota, over 10 to 20% of soil samples have more than 60 lb/acre nitrate-N (0-24 inch soil profile) remaining after wheat.

What about Prevented Planting or unseeded acres?

For Prevented Planting or unseeded acres, the factors above plus some additional factors will affect the amount of residual nitrate-nitrogen:

1.     How long was water standing on the field?
2.     Was weed growth controlled, early or late?
3.     Was tillage used? How many times? How deep?
4.     Was a cover crop planted? What amount of growth was achieved?

When submitting soil samples from fields that were not planted, please choose “Fallow” or “Cover Crop” as the previous crop. This will allow us to send additional information on soil nitrate trends for unseeded and cover crop fields once we get enough data.

As the fall soil testing season continues, we will keep you updated. If you have any questions, please call our experienced agronomic staff. We hope you have a safe harvest and soil testing season.


Corn Growth and Development – Are we behind?

This article originally appeared in the AGVISE Laboratories Fall 2022 Newsletter under Southern Trends

The spring and early summer were very interesting to say the least. Spring rains continued well into late May and delayed planting for sugar beet, corn, and soybean throughout the southern region. By mid-May, many producers changed long-day corn maturities to earlier corn maturities. In the Benson, MN neighborhood, corn planting finally got underway around May 20 (60% planted) and near completion on June 5 (93% planted). Around the coffee shop, many people have commented, “How far behind is the corn crop in 2022?” So, let’s put some numbers to this question.

The High Plains Regional Climate Center has a nice growing degree day (GDD) calculator for simulations of corn growth and development (https://hprcc.unl.edu/agroclimate/gdd.php). I made a few GDD simulations for previous years, comparing 2022 with 2019 (a below-average GDD year) and 2021 (an incredible GDD year). As of mid-July, the 2022 growing season was 3 days ahead of 2019 (63 more GDD) and 9 days behind 2021 (182 fewer GDD). A corn plant takes about three days to make a new leaf when the corn plant is V12 and younger, so you can guesstimate that we were about 3 leaf stages behind 2021.

With the late spring planting window, many corn producers around Benson, MN opted for corn maturities about 6 to 8 days earlier than normal. If you compare an earlier 92-day corn maturity with a more typical 100-day corn maturity, the required GDD to blacklayer is 2207 and 2401 GDD, respectively. We generally accumulate 20-30 GDD per day in midsummer. If either corn maturity was planted on May 20, the estimated silking (R1 stage) date is July 21 for the 92-day maturity and July 25 for the 100-day maturity, a difference of four days. Similarly, the estimated blacklayer (R6 stage) date is September 18 for the 92-day maturity and October 12 for the 100-day maturity, a difference of 24 days. Toward the end of the growing season when fewer GDD are accumulated per day, the difference in maturity groups really starts to show. Warmer than average temperatures will shorten that difference, but only time will tell if the right decision was to plant earlier corn maturities.

Nielsen, R. L. The Planting Date Conundrum. Corny News Network, Apr. 2022. Purdue Univ., West Lafayette, IN. https://www.agry.purdue.edu/ext/corn/news/timeless/pltdatecornyld.html

To help drive home the point about planting date and final corn grain yield, I really like the graph from Dr. Bob Nielsen at Purdue University (figure above). Early planting does not always result in very high corn yield, and late planting does not always result in very low corn yield. In 2022, late planting will limit top-end crop yield potential, but the final crop yield could still be good as long as GDD accumulation remains above average. As always, Mother Nature will be the final determinant in setting the final crop yield.