Small grain harvest is well underway across the region, and soil testing is progressing quickly. Crop yields have varied from below average to exceeding expectations across the region and often in the same area. Planting date, summer temperatures, and rainfall (too little or too much) were major factors this year.
The major factors influencing the amount of residual soil nitrate-N after crops are:
1. Nitrogen fertilizer rate: too high or too low
2. Crop yield achieved: much lower or higher than expected
3. Nitrogen losses: denitrification and leaching after too much rainfall
4. Nitrogen mineralization from organic matter: cool or warm growing season
Seasonal weather is a large driving factor in the amount of nitrate-N in the soil profile. This changes from field to field and year to year. Early spring weather conditions were very wet across much of the region. In June and July, some areas continued to receive adequate to excess rainfall. Meanwhile, other areas received very little rain in the late growing season.
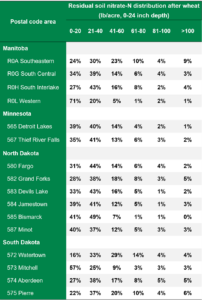
AGVISE has tested over 10,000 soil samples from wheat fields across the region. The table below indicates the percentage of soil samples in each soil nitrate-nitrogen category in several areas of Manitoba, Minnesota, North Dakota, and South Dakota. The data should give you a general idea of how variable residual soil nitrate is from field to field in each region. With such variable crop yields, there is quite a bit of variability in residual nitrate following wheat in the region. In drought-affected areas of Minnesota, North Dakota, and South Dakota, over 10 to 20% of soil samples have more than 60 lb/acre nitrate-N (0-24 inch soil profile) remaining after wheat.
 What about Prevented Planting or unseeded acres?
For Prevented Planting or unseeded acres, the factors above plus some additional factors will affect the amount of residual nitrate-nitrogen:
1. How long was water standing on the field?
2. Was weed growth controlled, early or late?
3. Was tillage used? How many times? How deep?
4. Was a cover crop planted? What amount of growth was achieved?
When submitting soil samples from fields that were not planted, please choose “Fallow” or “Cover Crop” as the previous crop. This will allow us to send additional information on soil nitrate trends for unseeded and cover crop fields once we get enough data.
As the fall soil testing season continues, we will keep you updated. If you have any questions, please call our experienced agronomic staff. We hope you have a safe harvest and soil testing season.
Zone Soil Sampling: How Many Zones?
in Precision Ag, Regional Data/by John BrekerZone soil sampling has become a standard practice in precision nutrient management, but the grand question remains – How many zones should you be soil sampling?
Well, it depends! It just makes sense that a field with more variability requires more zones than a field with little variability. Zone soil sampling separates parts of fields that behave differently into similar zones that can be managed together. Common data layers used to build zone soil sampling maps include satellite imagery, plant vegetation indices, crop yield, salinity, topography, and even bare soil color.
As a soil testing laboratory, AGVISE does not know what data layers are used to create the zone maps, but we do know the soil nutrient levels in each zone. Clients often ask how many zone soil samples should be collected in each field to get the best soil nutrient information. Common sense tells us that splitting fields into more zones should provide more detailed soil nutrient data.
With soil test data from thousands of zone soil sampled fields, we mined the AGVISE database to see what the average range in soil test levels per field (high testing zone minus low testing zone) could tell us about field variability and the number of zones that should be sampled. The table summarizes the average range in soil test levels for over 24,000 zone soil sampled fields in 2023. The number of zones ranges from 3 to 8 zones per field. You can see, as the number of zones increases, the difference between the high zone and low zone gets larger and larger.
This data reminds us that more zones per field can tell us more about the soil nutrient status in each field, providing more powerful information to develop variable-rate fertilizer applications. If you have variable landscapes with rolling topography, diverse soil types, or salinity problems, you may have to take more zone soil samples per field (5-7 zones) to see the greatest differences in soil fertility and to take full advantage of variable-rate fertilizer applications. If your landscapes have less variability with fewer soil types, relatively flat topography, and no salinity problems, then you can probably take fewer zone samples per field (3-4 zones).
Winter Soil Sampling: You Need the Right Tools
in Equipment/by John BrekerSnowfall in late October and November slowed harvest and soil sampling across the region. This means some fields will be soil sampled in December and maybe January as harvest for late-season crops continues in the snow.
The right equipment is the key to any project, and winter soil sampling is no different. AGVISE heavy-duty (HD) chromoly soil probes were designed for hard, frozen soil conditions. Chromoly steel is much tougher than stainless steel, and it handles the stress of sampling frozen soil. To punch through several inches of frost, you will also require additional weight. Most soil sampling trucks have the hydraulic cylinder mounted inside the truck cab, where you can take advantage of the entire truck weight to push through the frost. This enables you to take soil samples through 4 to 6 inches of frost on most medium- and fine-textured soils in winter. For receiver hitch-mounted hydraulic cylinders, you will need to add extra weight in the truck box, and it may limit you to pushing through only 1 to 3 inches of frost.
AGVISE offers wet and dry soil probe tips for the HD chromoly soil probe. The wet soil probe tip is best suited for frozen soils. The HD chromoly soil probe is available with or without a slot.
You can view examples of in-cab and receiver hitch-mounted hydraulic soil sampling systems on our website (https://www.agvise.com/installed-soil-sampling-kit-examples/). You can also find videos of soil sampling in frozen soils with the HD chromoly soil probe and wet soil probe tip.
The Results Are In: Lime Works
in Uncategorized/by Jodi BoeIn the fall of 2022, I hired a custom applicator to haul and spread lime across 238 acres of my family’s farm in western North Dakota. The reason? To increase soil pH on five fields with very low soil pH. One field even had a soil pH of 4.7, so these were good candidate fields for a practical case study for liming on a real farm operation.
I wrote more about the soil sampling process and lime application in the AGVISE Winter 2022 newsletter (https://www.agvise.com/wp-content/uploads/2022/11/AGVISE-Newsletter-2022-Winter.pdf). Each field received approximately 2 ton/acre sugar beet lime (1.4 ton ENP/acre) from Sidney Sugar in Sidney, MT, and the lime was disced to 3 inches for incorporation. After one year, the soil pH had already increased by 0.36 pH-units in the 0-6 inch soil depth. The 2023 growing season was relatively wet in southwest North Dakota, and the additional soil water certainly helped the lime react and neutralize soil acidity quickly. The incorporation with a disc also helped distribute the lime more evenly and deeply, allowing the lime to react faster. One negative side effect of tillage was a flush of annual weeds, particularly green and yellow foxtail.This was the first tillage event on these fields in 12 years, so I expect the annual weed community to diminish as we return to no-till after the one-time tillage pass.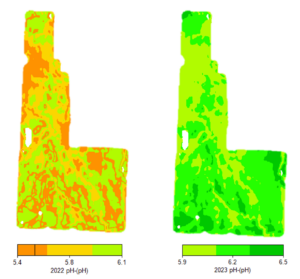
Figure 1. Zone soil pH map of a field receiving 2 ton/acre sugar beet lime in fall 2022. Each zone increased roughly 0.36 pH-units from 2022 to 2023. (Maps created in ADMS 32, GK Technology, Inc.)
Lime also works without incorporation, just at a slower pace. In 2021, we established a no-till lime trial to investigate lime rates without incorporation. Lime was applied in May 2021, and the fall 2023 soil pH results are shown in Figure 2. The highest lime rate at 2.5 ton ENP/acre increased soil pH in the upper 0-3 inch soil depth by 0.71 pH-units over 2.5 years. So far, no effect on soil pH in the lower 3-6 inch soil depth has been observed. In most no-till systems, the most acidic part of the soil profile is located at the soil surface, and a lime application correcting soil pH in the upper 0-3 inch soil depth is still effective. This is where seedlings and roots are most vulnerable to soil acidity, so correcting soil pH at the soil surface is critical and can be accomplished with a surface application of lime in no-till systems.
Surface Soil pH (0-3 inch) in No-till Lime Trial, October 2023
Figure 2. Soil pH following surface application of lime after 2.5 years in a no-till cropping system in southwestern North Dakota.
Soil Nitrogen Trends – Fall 2023: Some Up, Some Down
in Drought, Nitrogen, Regional Data, Uncategorized, Wheat/by John BrekerThe 2023 drought was an all-too-soon reminder of the widespread 2021 drought. It covered much of the upper Midwest, Great Plains, and Canadian Prairies. From previous experience with droughts, we expected that residual soil nitrate-N following crops would be higher than normal, caused by the drought and reduced crop yields. The first wheat fields that were soil tested in August and September confirmed our expectation that residual soil nitrate-N was already trending higher than normal. Yet, some regions were spared the drought and received above-average rainfall, and achieved record-setting crop yields. For these regions, the amount of residual soil nitrate-N after high-yielding crops was near or below average.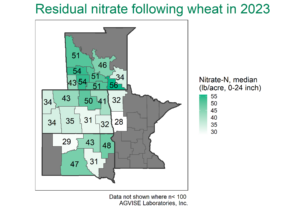
The 2023 AGVISE soil test summary data highlights the great variability following the drought. The median amount of soil nitrate-nitrogen across the region was higher than the long-term average following wheat. Over 28% of wheat fields had more than 60 lb/acre nitrate-N (0-24 inch) remaining. Yet, another 17% of wheat fields had less than 20 lb/acre nitrate-N remaining, suggesting either lost crop yield or protein due to insufficient nitrogen nutrition. For any given farm, the great variability in residual soil nitrate-N across all acres makes choosing one single nitrogen fertilizer rate impossible for next year, and soil testing is the only way to decide that right rate for each field.
Through zone soil sampling, we are also able to identify that residual soil nitrate-nitrogen can vary considerably within the same field. This makes sense because we know that some areas of the field produced a fair or good yield, leaving behind less soil nitrate, while other areas produced very poorly and left behind much more soil nitrate. These differences across the landscape are driven by soil texture, soil organic matter, and stored soil water as well as specific problems like soil salinity or low soil pH (aluminum toxicity). Although the regional residual soil nitrate-nitrogen trends were higher overall, it is truly through zone soil sampling that we can begin to make sense of the field variability that drives crop productivity and determine the right fertilizer rate for next year.
For fields that have not been soil tested yet, there is still time to collect soil samples in winter. Nobody wants to experience another drought, but this kind of weather reminds us how important soil nitrate testing is every year for producers in the Great Plains and Canadian Prairies. Each year, AGVISE summarizes soil test data for soil nutrients and properties in our major trade regions of the United States and Canada. For more soil test summary data and other crops, please view our soil test summaries online: https://www.agvise.com/resources/soil-test-summaries/
Choosing the Right Phosphorus Method
in Phosphorus, Soil Chemical Analysis/by Cindy EvensonThis article originally appeared in the AGVISE Laboratories Spring 2023 Newsletter under President’s Corner
The phosphorus soil test debate never ends. Should I use the Olsen test, or maybe Bray-1 would be better? What about the Mehlich-3 method, and should that extract be analyzed on an ICP or with a colorimetric method? Perhaps, Bray-2 or the Haney extractable P is something to consider? This whole phosphorus test dilemma can be quite confusing; however, the answer is quite simple. Use the soil phosphorus test that is calibrated for your region!
In the upper Midwest, the Olsen test is the most reliable method to determine phosphorus availability and has the most correlation and calibration data with field trials. Many hours have been spent by university researchers putting out field trials to determine phosphorus fertilizer rates for various crops. The researchers have evaluated various phosphorus methods, and the two most common methods are the Bray-1 and Olsen extractants. The Bray-1 method is the older method, developed in Illinois. It works well on soils with pH below 7.3. Once the soil pH is above 7.3, the extractant may fail. If the test fails, it will produce a result near zero.
The Olsen method is required on calcareous soils (pH > 7.3), but it also works well on acidic soils. There is a common misconception that the Olsen method is only suitable on calcareous soils. In fact, the Olsen method is widely used across the world because of its versatility on acidic and calcareous soils. It is a perfect fit for our region because it works so well across a wide soil pH range and on diverse soil types. In the AGVISE Newsletter Spring 2017 issue, retired AGVISE President Robert Deutsch compiled soil test data for the Bray-1 and Olsen methods with over 25,000 soil samples. The graphs highlight how robust the Olsen phosphorus method is, working on acidic and calcareous soils alike.
The Mehlich-3 method has gained popularity in the southeast United States and the central Midwest. In these regions, the soils are more weathered and often do not have problems with high calcium carbonate content. At the University of Minnesota, Dr. Dan Kaiser has worked on Mehlich-3 method correlation on Minnesota soils for quite a few years. For some soils, the Mehlich-3 method performed as expected, while some others had Mehlich-3 results 8 to 10 times higher than expected. For these reasons, the Mehlich-3 method has not been approved for use in the upper Midwest or northern Great Plains.
As of this time the only phosphorus soil tests recommended for soils in the upper Midwest are the Olsen and Bray-1 extracts. If someone mentions using any other phosphorus soil test, it has not been tested or correlated to the soils in this region.
Are Soybean Iron Deficiency Chlorosis (IDC) Ratings Getting Worse?
in Iron, Soybean/by John BrekerThis article originally appeared in the AGVISE Laboratories Spring 2023 Newsletter
For the past three years, we have seen severe and widespread soybean iron deficiency chlorosis (IDC) symptoms across the region. In fact, some seasoned agronomists have commented that 2022 was the worst soybean IDC year that they had experienced in decades. Soybean IDC is a serious risk on soils with high calcium carbonate or salinity, which interfere with iron uptake and utilization in soybean. With all that we have learned about soybean IDC risk and management over the past 30 years, we have to ask, “What is going on? Why is soybean IDC continuing to get worse?”
The NDSU soybean IDC trial data suggests it might be the soybean varieties. Each year, seed companies submit soybean varieties to NDSU for independent evaluation of soybean IDC ratings (https://www.ag.ndsu.edu/varietytrials/). The NDSU trial sites impose high soybean IDC risk, where the best and worst soybean varieties are thoroughly tested alike for soybean IDC tolerance. In recent years, the problem is that the year-after-year average soybean IDC rating continues to get worse (see figure). In 2022, the average soybean variety scored 3.5 on the NDSU scale (1-good, 5-bad). Adverse soil and weather conditions may explain part of the worsening problem in the NDSU trials, but it is apparent that few soybean varieties can handle severe soybean IDC on their own. In defense of soybean breeders, there are a lot of different breeding objectives on their plates right now, including herbicide tolerance packages, disease and insect pests, and seed yield, of course!
This means we need to revisit and use all of our options in the soybean IDC toolbox. We have known about these effective management tools for over 20 years, and we are going to need to use all of them until soybean variety IDC tolerance can get to where we need it.
Steps to better soybean IDC management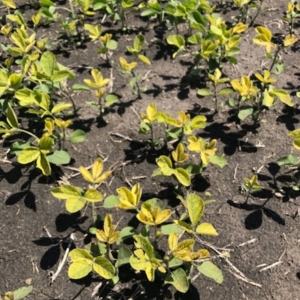
Two Graphics You Should Know Before the 2023 Growing Season
in Nitrogen, Phosphorus, Potassium/by Jodi BoeThis article originally appeared in the AGVISE Laboratories Spring 2023 Newsletter
The goal of AGVISE Newsletters is to inform you and your customers of important soil fertility information relevant to our area. Often, visuals or graphs are much more powerful at communicating a message than words. With that in mind, I want to share two figures I think you should know about going into the 2023 growing season with a short synopsis and where you can find more information on the topic.
Right now, there are many biological products and fertilizer additives on the market. In particular, asymbiotic nitrogen-fixing products have gained a lot of attention, but many have little or no university research evaluating them. Any grower wanting to try new products should test them on a small acreage first, before adopting them across the whole farm. To the left is a diagram of how such an on-farm trial would look. The key factors of a meaningful on-farm trial include a control treatment (the standard practice), the standard practice plus the product, and randomized replication (at least three replicates, randomized so that one treatment is not always on the east or west side of the trial area).
If the standard nitrogen rate will be reduced when the product is used, a treatment should also be included that compares the same reduced nitrogen rate without the product (this three-treatment setup is what is pictured). If the standard nitrogen rate is higher than the crop N requirement, maybe if you do not have a current soil nitrate-N test or just general overapplication, a reduced nitrogen rate plus the product that produces the same crop yield as the standard practice does not mean that the product is producing additional nitrogen for the crop; it may just mean that the grower can cut back their standard nitrogen rate.
Slide from Dr. John Jones’ 2023 AGVISE Seminar presentation, Phosphorus and Potassium: A Fresh Look with Fresh Data https://www.agvise.com/resources/seminars-and-events/
With fertilizer prices remaining high, it is tempting to cut back phosphorus and potassium inputs to save money. As tempting as this is, do not cut back farther than the fertilizer rates needed to meet the critical soil test level, as optimum soil-test P and K levels are required to achieve the highest response from nitrogen fertilizer. While working to update the Wisconsin phosphorus and potassium fertilizer guidelines, Dr. John Jones at the University of Wisconsin has put together some excellent data illustrating the reality of Liebig’s Law of the Minimum: when P and K fertility needs are unmet, the return from nitrogen fertilizer investment will be reduced compared to when P and K are at optimum levels. This means pouring on more nitrogen will not increase crop yield unless you are doing a good job of managing P and K too. Although not shown here, Dr. Jones also has data showing that corn and soybean yield response to P is reduced when K fertility needs are unmet.
John Breker Appointed to NAPT Oversight Committee
in Quality Control/by John BrekerThis article originally appeared in the AGVISE Laboratories Spring 2023 Newsletter
John Breker was appointed to the North American Proficiency Testing Program Oversight Committee as the North Central Region representative, starting in January 2023. The North American Proficiency Testing (NAPT) Program assists soil, plant, and water laboratories with quality control and quality assurance through inter-laboratory sample exchanges as well as statistical evaluation of the analytical data. These tools help laboratories generate accurate and precise analyses, as well as provide confidence to clients that their data meets high standards.
The NAPT program guidelines have been developed for the agricultural laboratory industry by groups involved with standardizing soil and plant analysis methods in the United States and Canada. The program is authorized through the Soil Science Society of America (SSSA) and administered by the NAPT Oversight Committee, composed of representatives from regional soil and plant analysis workgroups, state/provincial departments of agriculture, and private and public soil and plant analysis laboratories.
AGVISE Laboratories has been a member of the NAPT program since its inception. AGVISE Laboratories in Benson, MN and Northwood, ND participate in the soil, plant, and water programs through NAPT, as well as the Performance Assessment Program (PAP) required for participation in USDA-NRCS programs. AGVISE is a strong supporter of NAPT and the ongoing objectives of the NAPT program.
NAPT Program Objectives
High Fertilizer Prices? Using Crop Removal P & K Rates is an Expensive Choice
in Crop Removal, Phosphorus, Potassium/by John BrekerThis article originally appeared in the AGVISE Laboratories Spring 2023 Newsletter
If you thought high fertilizer prices would resolve after one or two years, it is looking like those prices are becoming the new norm. At such prices, every fertilizer dollar you spend must be spent to guarantee the best bang for each buck. This means soil testing makes more dollars and sense than ever.
Phosphorus and potassium are best managed with current soil test information to maximize crop yield potential and profitability. Yet, some people continue to apply phosphorus and potassium at crop removal (CR) rates as a way to maintain the soil fertility status quo. This is a major oversight because CR-based rates maintain soil fertility in a way that overapplies fertilizer to parts of the field with high soil test P or K that do not need more fertilizer, yet underapplies fertilizer to parts with low soil test P or K and ultimately sacrifices crop yield. This is particularly troublesome if the factor that limited crop yield was one of those nutrients! As a result, the reduced crop yield leads to a lower CR-based fertilizer rate that fails to fix the soil fertility issue, and you stay in a low soil fertility rut. For example, if soil test P is very low and limits crop yield, a crop removal-based P rate will undershoot the actual crop P requirement, resulting in reduced crop yield and continued nutrient mining year after year. A soil test-based P rate will show you exactly where more fertilizer is required to maximize crop yield and where you can reduce fertilizer rates to maximize profitability.
Another serious reason to avoid CR-based rates is the risk of off-site nutrient losses, especially phosphorus. When CR-based rates are applied on soils with high or very high soil test P, this increases the risk for environmental P loss to waterways that can degrade water quality and result in regulatory oversight. Precision soil sampling (grid or zone) and soil test-based fertilizer rates is the best way to maximize crop yield, profitability, and protect the environment.
Early Soil Nitrate Trends after Wheat in 2022
in Nitrogen, Regional Data, Wheat/by John BrekerSmall grain harvest is well underway across the region, and soil testing is progressing quickly. Crop yields have varied from below average to exceeding expectations across the region and often in the same area. Planting date, summer temperatures, and rainfall (too little or too much) were major factors this year.
The major factors influencing the amount of residual soil nitrate-N after crops are:
1. Nitrogen fertilizer rate: too high or too low
2. Crop yield achieved: much lower or higher than expected
3. Nitrogen losses: denitrification and leaching after too much rainfall
4. Nitrogen mineralization from organic matter: cool or warm growing season
Seasonal weather is a large driving factor in the amount of nitrate-N in the soil profile. This changes from field to field and year to year. Early spring weather conditions were very wet across much of the region. In June and July, some areas continued to receive adequate to excess rainfall. Meanwhile, other areas received very little rain in the late growing season.
AGVISE has tested over 10,000 soil samples from wheat fields across the region. The table below indicates the percentage of soil samples in each soil nitrate-nitrogen category in several areas of Manitoba, Minnesota, North Dakota, and South Dakota. The data should give you a general idea of how variable residual soil nitrate is from field to field in each region. With such variable crop yields, there is quite a bit of variability in residual nitrate following wheat in the region. In drought-affected areas of Minnesota, North Dakota, and South Dakota, over 10 to 20% of soil samples have more than 60 lb/acre nitrate-N (0-24 inch soil profile) remaining after wheat.
For Prevented Planting or unseeded acres, the factors above plus some additional factors will affect the amount of residual nitrate-nitrogen:
1. How long was water standing on the field?
2. Was weed growth controlled, early or late?
3. Was tillage used? How many times? How deep?
4. Was a cover crop planted? What amount of growth was achieved?
When submitting soil samples from fields that were not planted, please choose “Fallow” or “Cover Crop” as the previous crop. This will allow us to send additional information on soil nitrate trends for unseeded and cover crop fields once we get enough data.
As the fall soil testing season continues, we will keep you updated. If you have any questions, please call our experienced agronomic staff. We hope you have a safe harvest and soil testing season.